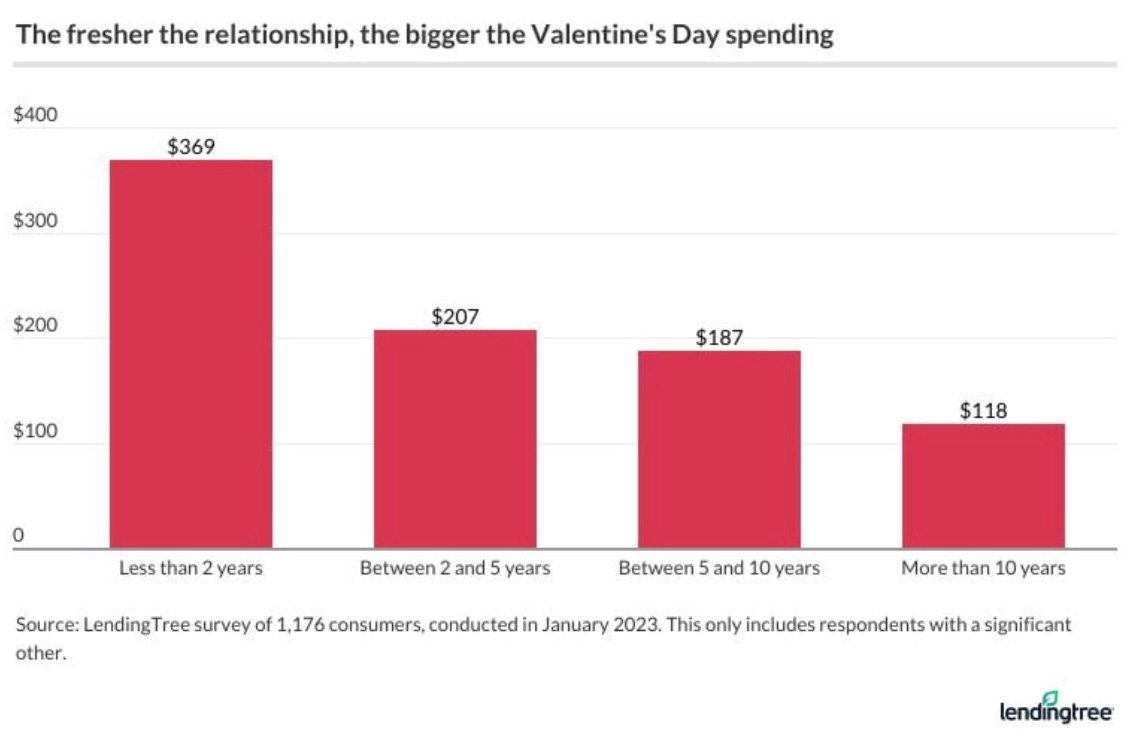
Today I provide a quick update on my custom “aggregate risk on vs risk off index” I first introduced in the Chart of the Day on February 1, 2023. I’ve also included an additional, holiday related chart at the end.
As a reminder, from my 2/1/2023 post:
The custom index is a simple, equal weight index of the following inter-market relationships:
1. High Beta (SPHB) vs Low Volatility (SPLV)
2. Discretionary (XLY) vs Staples (XLP)
3. Junk Bonds (JNK) vs Treasuries (IEF)
4. Semiconductors (SMH) vs S&P 500 (SPY)
5. Financials (XLF) vs Utilities (XLU)
6. Stocks (SPY) vs Bonds (IEF)
The index, shown in Figure 1, was +1.05% on the day, while the major market indexes were essentially flat. This after the CPI for January came in worse than expected (inflation was hotter than anticipated). Also of note, the index closed at a new 2023 high, placing it solidly above the major pivot highs from summer 2022.
What does all of this suggest?
“Under the hood” of the market, the engine continues to fire on all cylinders as capital flows into areas of the market that are historically associated with risk seeking investor behavior. This is the price action that is necessary for a sustainable rally in risk assets, such as public equities.
Happy Valentine’s Day!
— Brant

Disclaimer: The content provided on the Capital Notes newsletter is for general information purposes only. No information, materials, services, and other content provided in this post constitute solicitation, recommendation, endorsement or any financial, investment, or other advice. Seek independent professional consultation in the form of legal, financial, and fiscal advice before making any investment decision. Always perform your own due diligence.


