Chart of the Day: May 24, 2023
Are Extreme Sentiments Signaling a Bullish Turn?
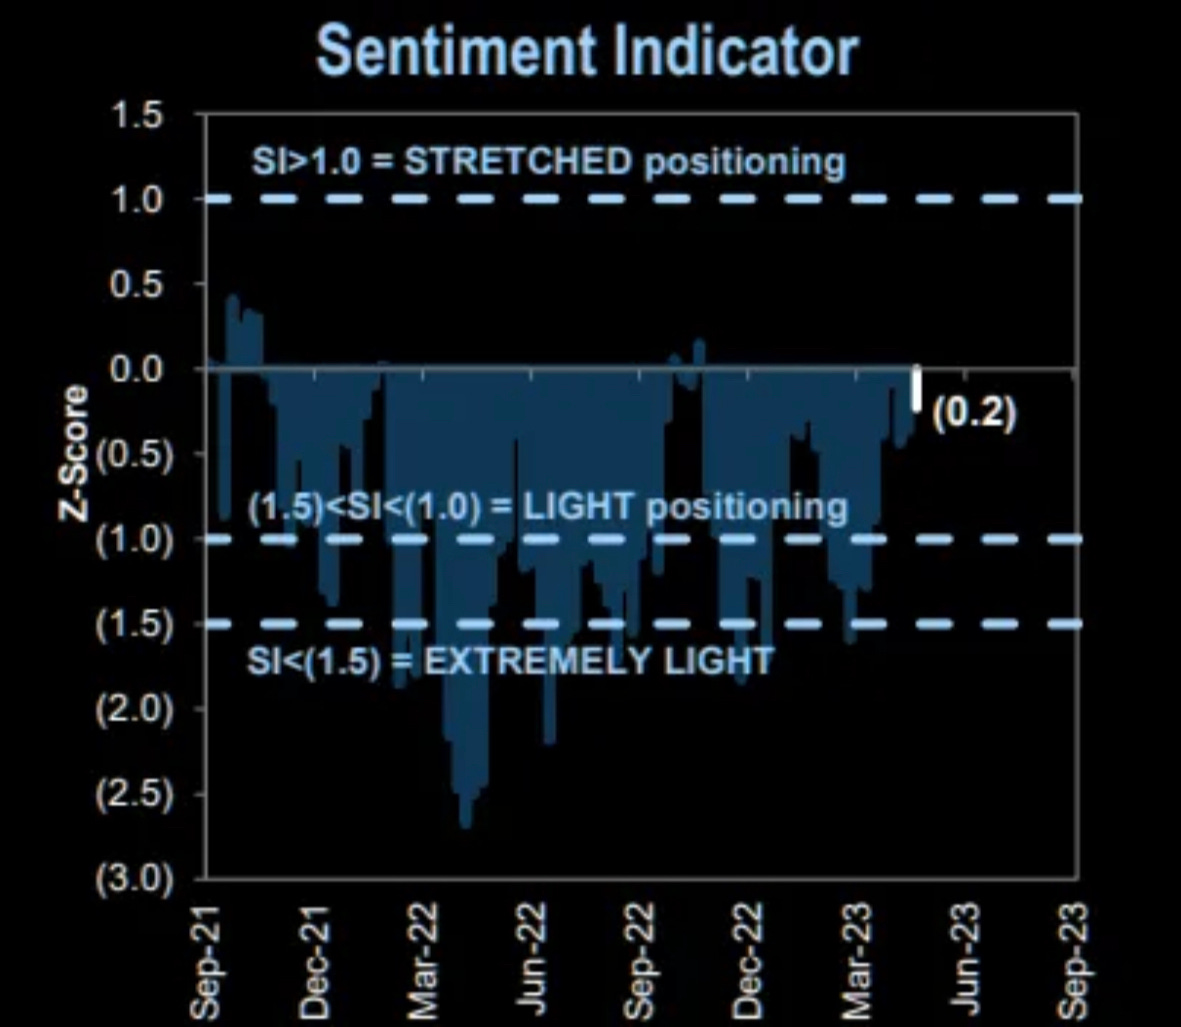
In today’s Chart of the Day we are running a 3 for 1 special, with each of the 3 charts presenting distinct measures of market sentiment. When viewed together, they suggest a potentially surprising twist in the current market narrative.
Chart Descriptions:
1. The first chart displays the Bloomberg CFTC CME E-Mini S&P 500 Net Non-Commercial Futures Positions from 2005 to the present. In simpler terms, it shows us how "non-commercial" market participants (think hedge funds, speculators) are betting on the S&P 500's future performance.
2. The second chart displays the Goldman Sachs 'Sentiment & Positioning' indicator since September 2021. This indicator measures how stretched stock market sentiment is at any given point.
3. The third chart, a bar chart, depicts the VIX average daily call options volume each month from early 2020. A "call option" on the VIX is essentially a bet that market volatility will increase.
Key Takeaways:
The common thread across these charts is extreme sentiment. The first chart reveals an extraordinarily large net short position on S&P 500 futures among non-commercial market participants, not seen since 2007. The second chart shows that despite the recent rally, market sentiment, according to Goldman Sachs, remains negative. Finally, the third chart shows traders betting on a sharp increase in volatility, reminiscent of the COVID crash era.
Impact on the Economy/Financial Markets:
Taken together, these charts depict an environment of deep skepticism and pessimism about the stock market's outlook. However, such extreme sentiments often present contrarian opportunities. As behavioral finance literature suggests, when crowd sentiment leans heavily in one direction, it might be wise to bet against it.
Actionable Insights:
For savvy investors, these charts may point to a contrarian bullish signal. Despite the overarching negative sentiment, these moments of extreme pessimism have historically been followed by bullish phases. Investors might consider whether this could be an opportune moment to take a more bullish stance on the stock market.
Educational Aspect:
These charts demonstrate the psychological aspect of investing, where herd mentality often leads to overreactions in the market. They also highlight how sentiment indicators can offer insights into potential market turning points.
Conclusion:
Could this extreme pessimism be a sign that the markets are about to take a bullish turn and have fuel to sustain a longer term rally? It's a provocative thought to ponder as we track these and other trends. Be sure to subscribe and join us tomorrow for another Chart of the Day!
— Brant
Disclaimer: The content provided on the Capital Notes newsletter is for general information purposes only. No information, materials, services, and other content provided in this post constitute solicitation, recommendation, endorsement or any financial, investment, or other advice. Seek independent professional consultation in the form of legal, financial, and fiscal advice before making any investment decision. Always perform your own due diligence.


