Quick Note: The Bull Case
What is pointing to higher prices?
“The investor’s chief problem - and even his worst enemy - is likely to be himself.”
— Benjamin Graham
Fighting Bias
My analysis from late-July 2022 has turned out to be quite accurate. Here’s a quote from the conclusion:
However, this analyst believes the negatives currently outweigh the positives.
At this time, overall market conditions are not supportive of a durable stock market bottom. Based on the information analyzed within this post, the probability is on the side of continued volatility and asset market weakness.
Since that time the S&P 500 is down approximately 1%, but at one point had fallen 13.5%, between 7/25/2022 and 10/13/2022. The problem is, financial forecasting is extremely difficult — especially us flawed humans that bring our biases and predispositions into our analysis.
I learned to trade and invest during the bear market of 2007-2009. This experience had a lasting impact on my analysis and interpretation of events driving capital market. My main mistake, which is a bias I am luckily aware of, is interpreting data too often in a bearish fashion. I will often anchor my analysis around a single bearish data point even though the remainder of the data is suggesting higher prices.
Successful investors must be able to identify and correct for their inherent biases. I fight my bearishness by scheduling few minutes each week to steel man a bullish argument — thus forcing my brain to think through an upside scenario. This quick post is the result of this process.
Higher prices?
I see a few areas of my usual analysis pointing toward higher prices.
#1: Chart Pattern
There is currently a potential bullish chart pattern on the S&P 500.
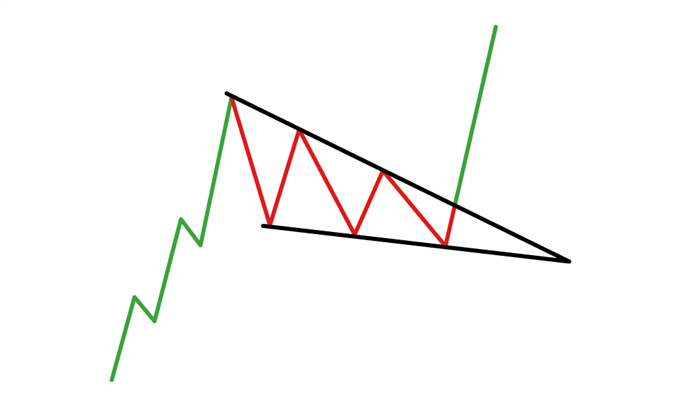
The SPY ETF is currently trading in what seems to be a bullish falling wedge pattern.
What is a bullish falling wedge?
Psychological Rationale:
A bullish falling wedge develops as a counter trend within a larger uptrend. It begins with extremely wide price movements and significant volatility but gradually the price range declines as a greater balance between buyers and sellers is achieved. When the upside breakout occurs, the balance is broken in favor of the bulls — the losers during the wedge formation. As a rally begins, short positions have to be covered as the upside price movement attracts new capital to the market. As a consequence, a quick advance is possible. Here is more on the psychological rationale behind the formation of bullish falling wedges — a quote from Martin Pring:
“This process is reinforced by the fact that participants become progressively more bearish as the wedge is formed, since they are used to a series of declining peaks and troughs. As the wedge narrows, a sense of calm sets in as the bears anticipate a downside breakout. The lack of volatility therefore lures them into a sense of false security.”
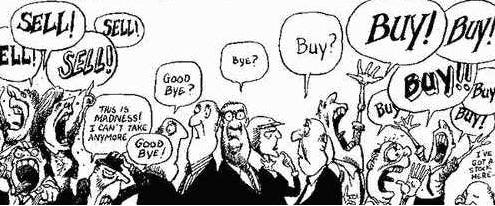
What Martin is saying is that as a wedge forms, sentiment in the market in question tends to become extremely bearish. Everyone shifts to one side of the boat. When an upside breakout occurs, it catches everyone off guard. Everyone is a buyer and it often results in an above-average rally. We can cross check this chart pattern formation with sentiment data to see if they align. See part 2 for a discussion of sentiment.
Here’s an example of a falling wedge that developed in gold during 2019.
Here is the weekly chart of the S&P 500 ETF, SPY, as of the close on January 11, 2023. As you can see, we had a prior uptrend and since January 2022 the market has formed a series of lower highs and lower lows. Connecting those lows and highs results in two trendlines that slowly converge over time — the definition of a bullish falling wedge. A weekly close above the upper trendline is the buy signal for this type of chart pattern. The price target is the beginning of the wedge — in other words, a retest of the all-time highs.
#2: Sentiment
As discussed in the description of the bullish falling wedge chart pattern — negative, bearish sentiment is a requirement for the pattern to be valid.
Here are a few measures of sentiment:
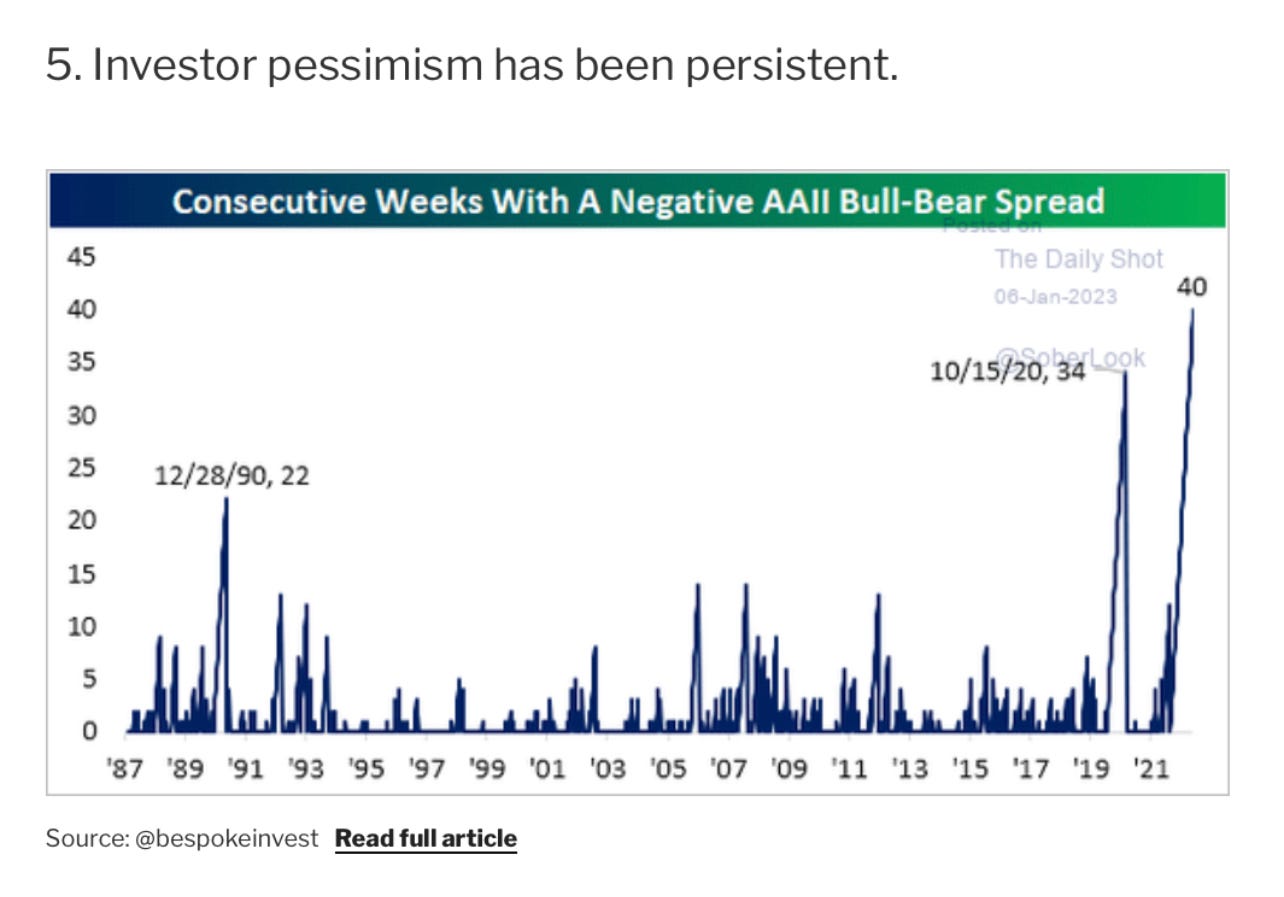
The AAII Survey has shown more bears than bulls consistently for 40 consecutive weeks. Essentially the entire time the falling wedge has been forming investor pessimism has been growing.

This is an aggregate indicator designed by Topdown Charts in an effort to measure investor euphoria. It is a combination of 3 separate pieces of data. When the Euphoriameter is in the lower end of its historical range, it suggest investor sentiment is washed out and markets could potentially be primed for a bullish reversal. Right now, this indicator is at one of the lowest levels seen since the late-1980s.

From Game of Trades we see the equity put/call ratio. It’s reaching a historic extreme as retail traders bet on a significant downside move. Retail represents the “crowd” and at major turning points the crowd is usually wrong.

Finally, another chart from Daily Chartbook . This shows that this is the most anticipated recession in history. In other words, everyone already expect a recession is in the cards for 2023. If that's the case, what's there to say market participants haven't already acted on this prediction? Thus, a significant recession that hasn't happened yet could already be completely discounted by the market into current prices -- clearing the way for a potential upside move.

Conclusion
Two bullish signs are aligning to provide a potential upside surprise in market prices. There is a clearly defined bullish falling wedge on the S&P 500 ETF, SPY, and market sentiment is confirming the the psychological state of market participants is aligned with what we should expect during the formation of a falling wedge.
Could the market surprise the majority of traders and move significantly higher from here? Yes, yes it could.
— Brant
Disclaimer: The content provided on the Capital Notes newsletter is for general information purposes only. No information, materials, services, and other content provided in this post constitute solicitation, recommendation, endorsement or any financial, investment, or other advice. Seek independent professional consultation in the form of legal, financial, and fiscal advice before making any investment decision. Always perform your own due diligence.


Great points. I cut my teeth in the 2006-2009 markets too. Great lessons that will last a lifetime! Definitely seeing some bullish leaning charting.
Yep. BTC lead mkts down. If it holds above 18k and can get through 21k. That’s worth noting.