“There is no evidence that the business cycle has been repealed.”
Alan Greenspan
When beginning my personal investment process, the first step is to identify which stage of the economic cycle I believe we are in. In this post, I will cover what stage of the cycle I believe the economy is in and how this information can help an investor make educated capital allocation decisions.
What are the stages of the economic cycle?
Starting with a new cycle reset, the stages are as follows — I’ll turn to Fidelity for a definition of each cycle stage:
Ice / Recession: “Features a contraction in economic activity. Corporate profits decline and credit is scarce for all economic factors. Monetary policy becomes more accommodative and inventories gradually fall despite low sales levels, setting up for the next recovery.”
Goldilocks: “Generally, a sharp recovery from recession, marked by an inflection from negative to positive growth in economic activity (e.g., gross domestic product, industrial production), then an accelerating growth rate. Credit conditions stop tightening amid easy monetary policy, creating a healthy environment for rapid profit margin expansion and profit growth. Business inventories are low, while sales growth improves significantly.”
Fire / Boom: “Typically the longest phase of the business cycle, the mid-cycle is characterized by a positive but more moderate rate of growth than that experienced during the early-cycle phase. Economic activity gathers momentum, credit growth becomes strong, and profitability is healthy against an accommodative—though increasingly neutral—monetary policy backdrop. Inventories and sales grow, reaching equilibrium relative to each other.”
Stagflation: “This phase is emblematic of an "overheated" economy poised to slip into recession and hindered by above-trend rates of inflation. Economic growth rates slow to "stall speed" against a backdrop of restrictive monetary policy, tightening credit availability, and deteriorating corporate profit margins. Inventories tend to build unexpectedly as sales growth declines.”
How long does a full economic cycle last?
Historically, this cycle, from peak to peak, typically last 5.5 years (66 months). It is important to realize that each stage is not equal in length. The average expansion last approximately 55 months while the average recession only 11 months. Each cycle is different and an analyst should not anchor expectations, to the point that they ignore evidence, around past cycle lengths.
Where are we in the economic cycle?
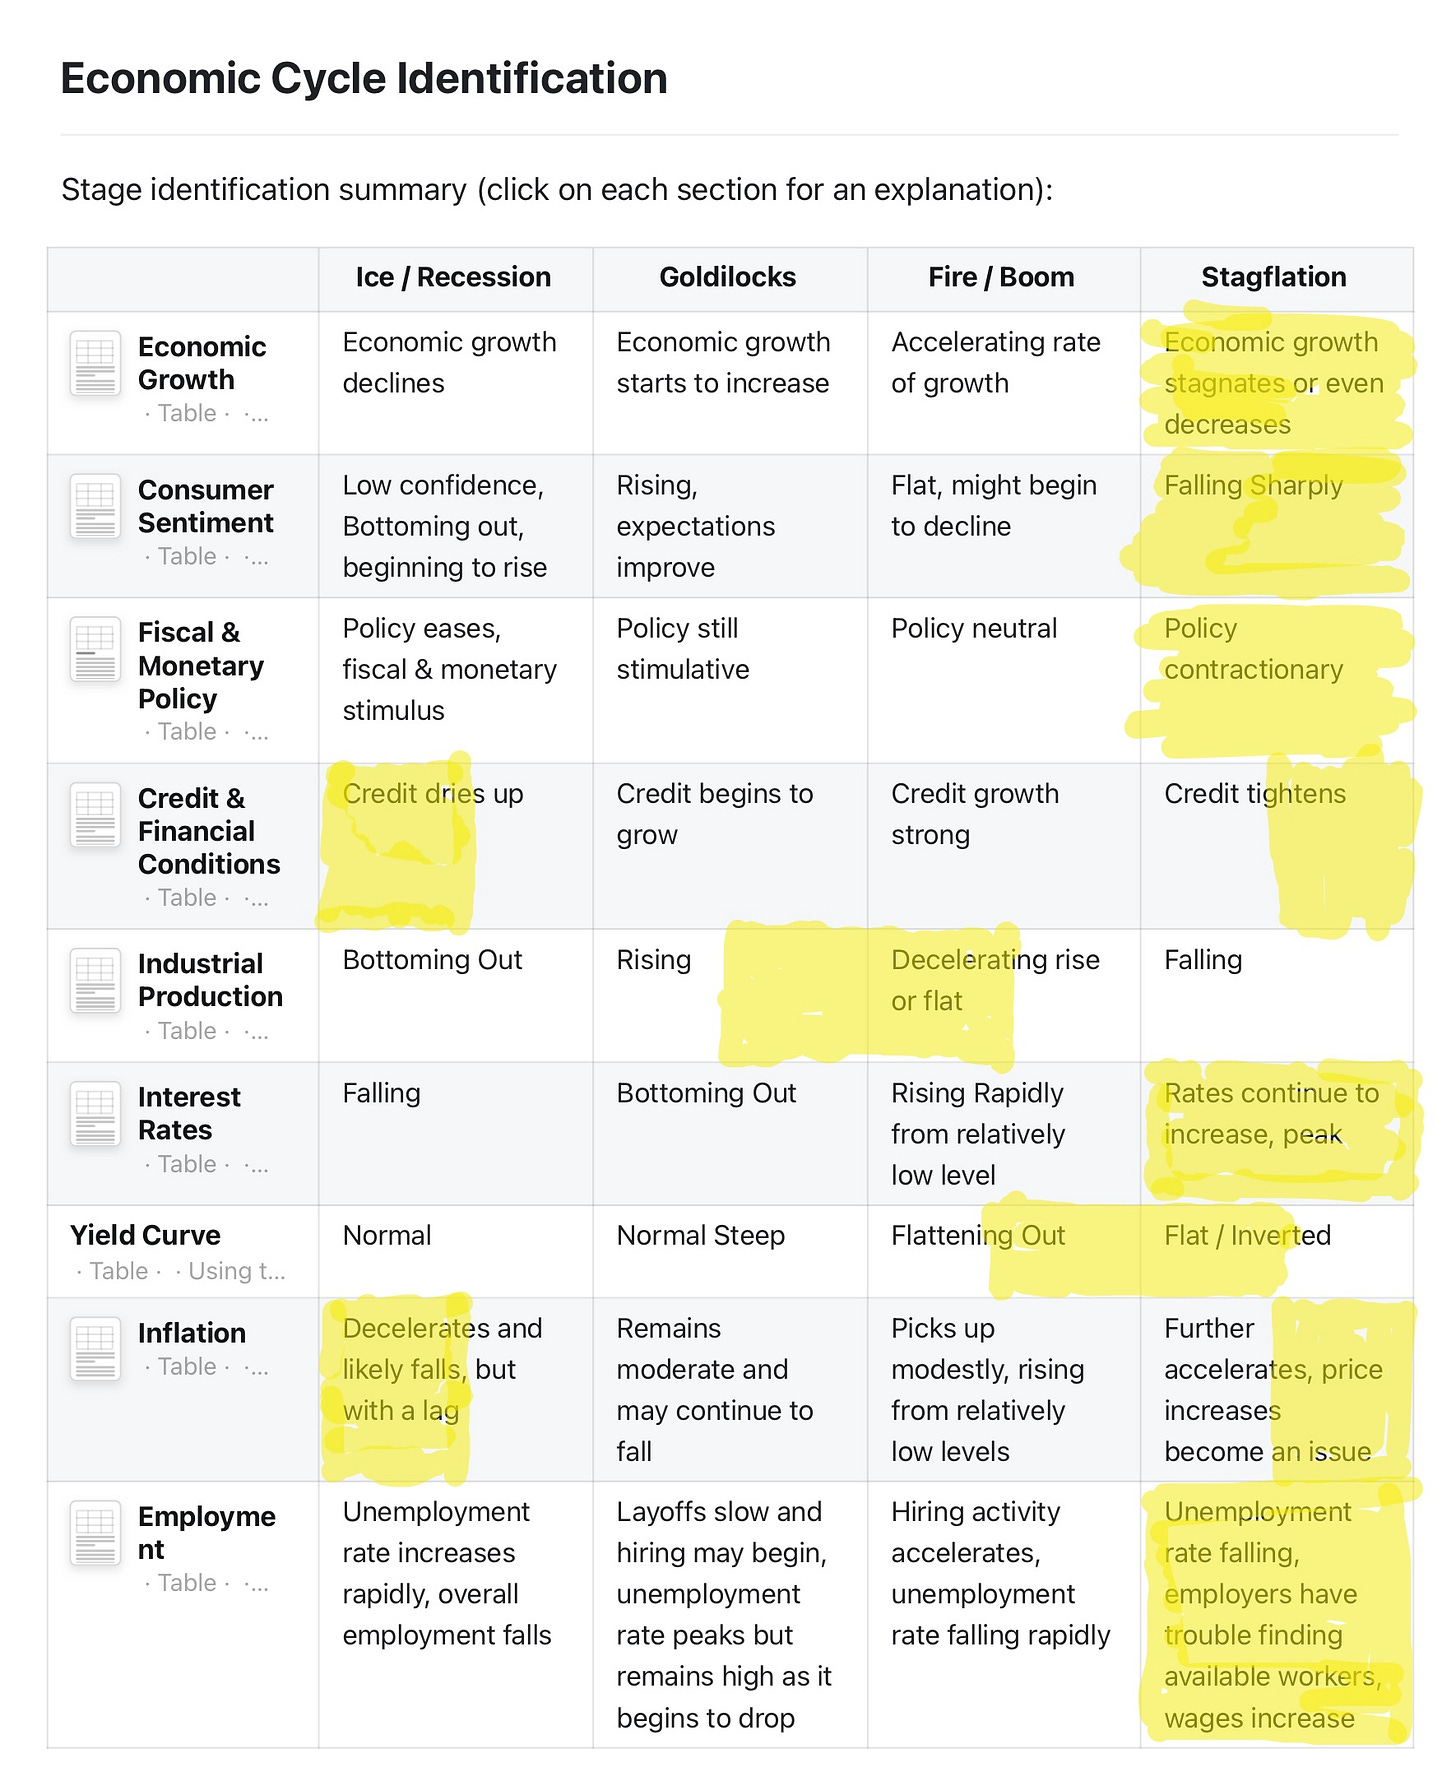
Throughout history, each of these stages has common themes that can be identified in various forms of economic and financial market data. Over time, I have put together a number of these indicators and defined what the indicator looks like in each stage of the cycle. Using a weight of evidence approach, one can make an educated guess at the current cycle stage.
Below is my current guess for the location of each indicator:
By my interpretation, 5 of the 9 indicators sit squarely within Stagflation. Here is a full summary:
Stagflation: 6.5 of 9 (72.22%)
Ice / Recession: 1 of 9 (11.11%)
Fire / Boom: 1 of 9 (11.11%)
Goldilocks: 0.5 of 9 (5.55%)
If we include indicators that have 1 foot in 2 stages, Stagflation takes a full 72.22% of the “evidence”.
Also, reading the definition of Stagflation provided by Fidelity, the data from the exercise above seems to confirm their qualitative description — we have “above-trend levels of inflation”, economic growth rates are “slowing to stall speed”, monetary policy is now “restrictive”, and inventories are building “unexpectedly”.
Primary takeaway: the economy is still in Stagflation.
Secondary takeaway: the next stage is Ice / Recession.
What else can we use to confirm our economic outlook?
Martin Pring developed a six stage business cycle model that has been presented in his books (which I highly recommend). The point of the model is to identify which of the three primary asset classes is likely to outperform during the different phases of the cycle. As the economic cycle progresses, asset classes tend to top and bottom in a predictable order:
Bonds top —> Stocks top —> Commodities top
Bonds bottom —> Stocks bottom —> Commodities bottom
This progression is driven by changes in interest rates, employment, consumer sentiment, inventory and investment cycles, etc. The full rationale for the bonds to stocks to commodities progression will be explored in a future post.
Knowing that asset class cycles tend to progress in a relatively reliable fashion, an investor can monitor the current state of the cycle for each asset class.
I use this chart to monitor these three asset classes.
The chart contains three panels. Panel 1 is bonds, represented by the 10 year US treasury bond. Panel 2 is stocks, represented by the S&P 500 Index. Panel 3 is commodities, represented by the Goldman Sachs Total Return Commodity Index. I use a momentum indicator overlay known as the KST (developed by Martin Pring). The KST overlay is used to gauge the status of the cycle for each commodity. I.e., I use the KST to determine of an asset has topped or bottomed.
The cycle is not perfect. However, typically it will follow the usual progression of bonds to stocks to commodities. Notice, bonds peaked in late-2021 and stocks peaked in early-2022. Therefore, both stocks and bonds are on KST sell signals and commodities remain on a KST buy signal. Based on Pring’s 6 stages, we are now in Stage 5. This is consistent with the economic cycle in the Stagflation stage.
If the cycle progresses as expected, commodities should peak next (Pring cycle stage 6) and then the cycle will start all over as bonds should bottom soon after or concurrent with the commodity top (Pring cycle stage 1).
A confirmed peak in commodities and a bottom in bonds (Pring cycle stage 1) would be highly suggestive of a rotation from Stagflation to Ice / Recession.
How does this information help us make intelligent investments?
Wrapping this post up with some signal for investors. Knowing the stage of the economic cycle can also help an investor pinpoint what sectors should outperform or underperform, both at that time and in the future. The following chart is from Fidelity. Here is how you can align Fidelity’s labels with the stages I use:
Recession cycle = Ice / Recession
Early cycle = Goldilocks
Mid cycle = Fire / Boom
Late cycle = Stagflation
As Fidelity’s chart suggest, during Stagflation an investor would do well by overweighting their portfolio in materials, consumer staples, health care, energy, and utilities.
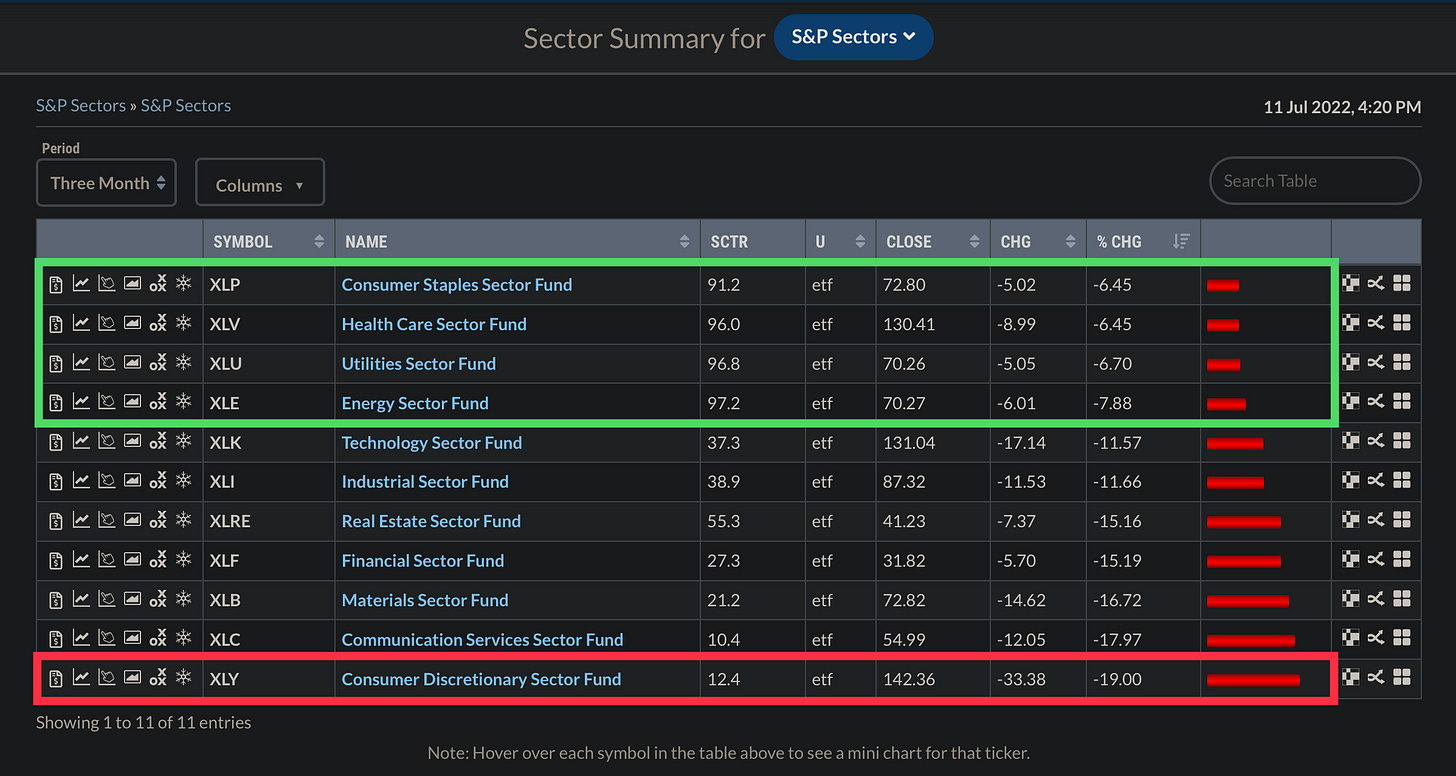
My analysis has been pointing at Stagflation since late-February. Here is a look at sector performance over the last three months:
Notice, the top 4 sectors over the last three months consisted of 4 of the 5 sectors identified by Fidelity as expected out-performers in the Stagflation stage of the economic cycle. The sector with the worst return was 1 of the 2 sectors identified as exported under-performers in the Stagflation stage. An investor that rotated allocation away from consumer discretionary and into staples, healthcare, utilities, and energy would have significantly outperformed the overall market during the last three months.
Conclusion
Economic Cycle Stage = Stagflation —> Ice / Recession
Pring Business Cycle Stage = Stage 5 —> Stage 6
As the economic cycle continues to progress, so should an investor’s expectations for sector and asset class performance.
During recession, a portfolio manager should play defense, focusing primarily on what sectors should be underweight or avoided altogether. Capital preservation is the name of the game.
Keep a close eye on the indicators of the economic cycle and watch for confirmation of a top in commodities (confirming a Pring stage 6). This, along with a bottom in bonds, will help to confirm a full move into recession.
Economic and business cycle analysis can be a powerful tool to help investors and portfolio managers direct funds across the various market sectors and asset classes. It is not a crystal ball for visualizing the future, but it can be used as a roadmap to help inform future asset allocation decisions.
— Brant
Disclaimer: The content provided on the Capital Notes newsletter is for general information purposes only. No information, materials, services, and other content provided in this post constitute solicitation, recommendation, endorsement or any financial, investment, or other advice. Seek independent professional consultation in the form of legal, financial, and fiscal advice before making any investment decision. Always perform your own due diligence.


