
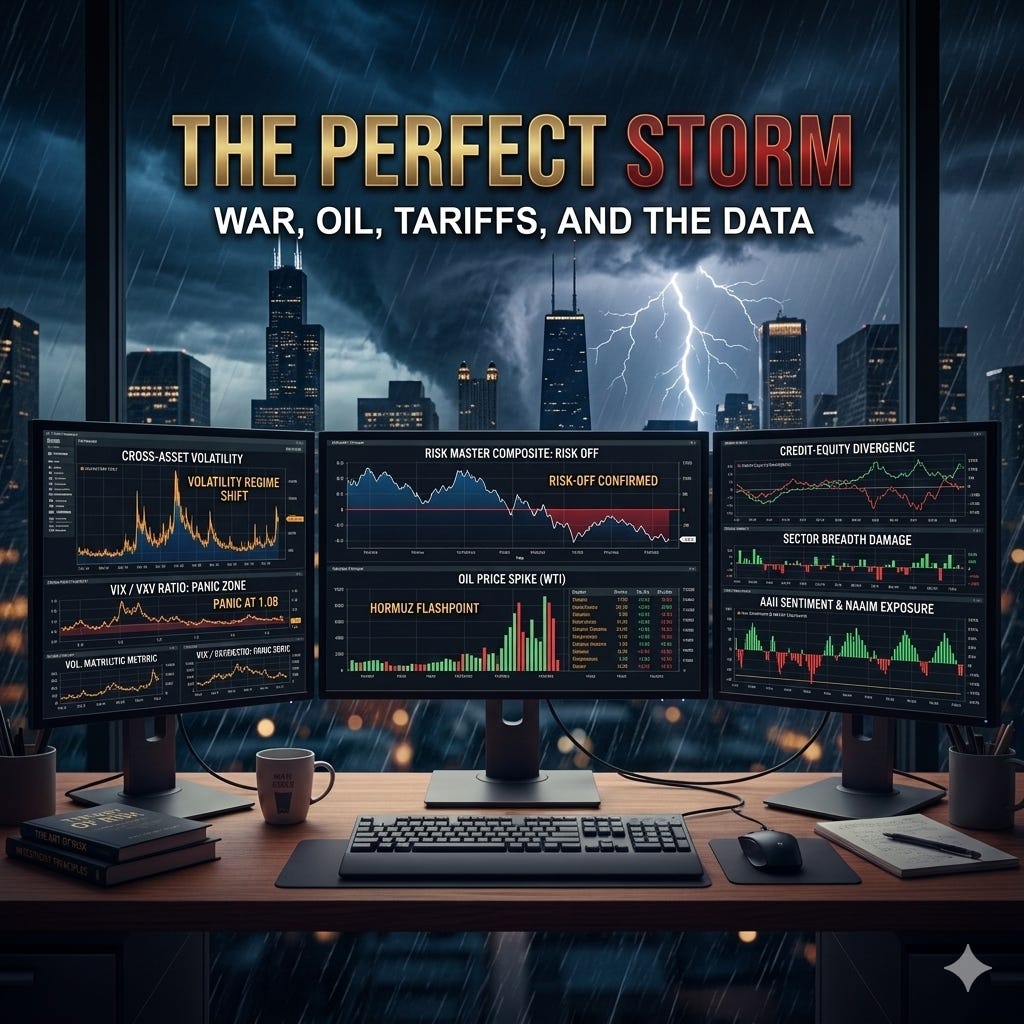
The Perfect Storm: War, Oil, Tariffs, and What the Data Actually Says
Volatility is back. Here’s where the evidence says we stand.

Ten days ago, the consensus was that 2026 would be a repeat of 2024: a slow grind higher powered by AI earnings, moderate growth, and a cooperative Fed. The soft landing was in. Recession risk was out. Investors were positioned accordingly.
Then the U.S. and Israel struck Iran.
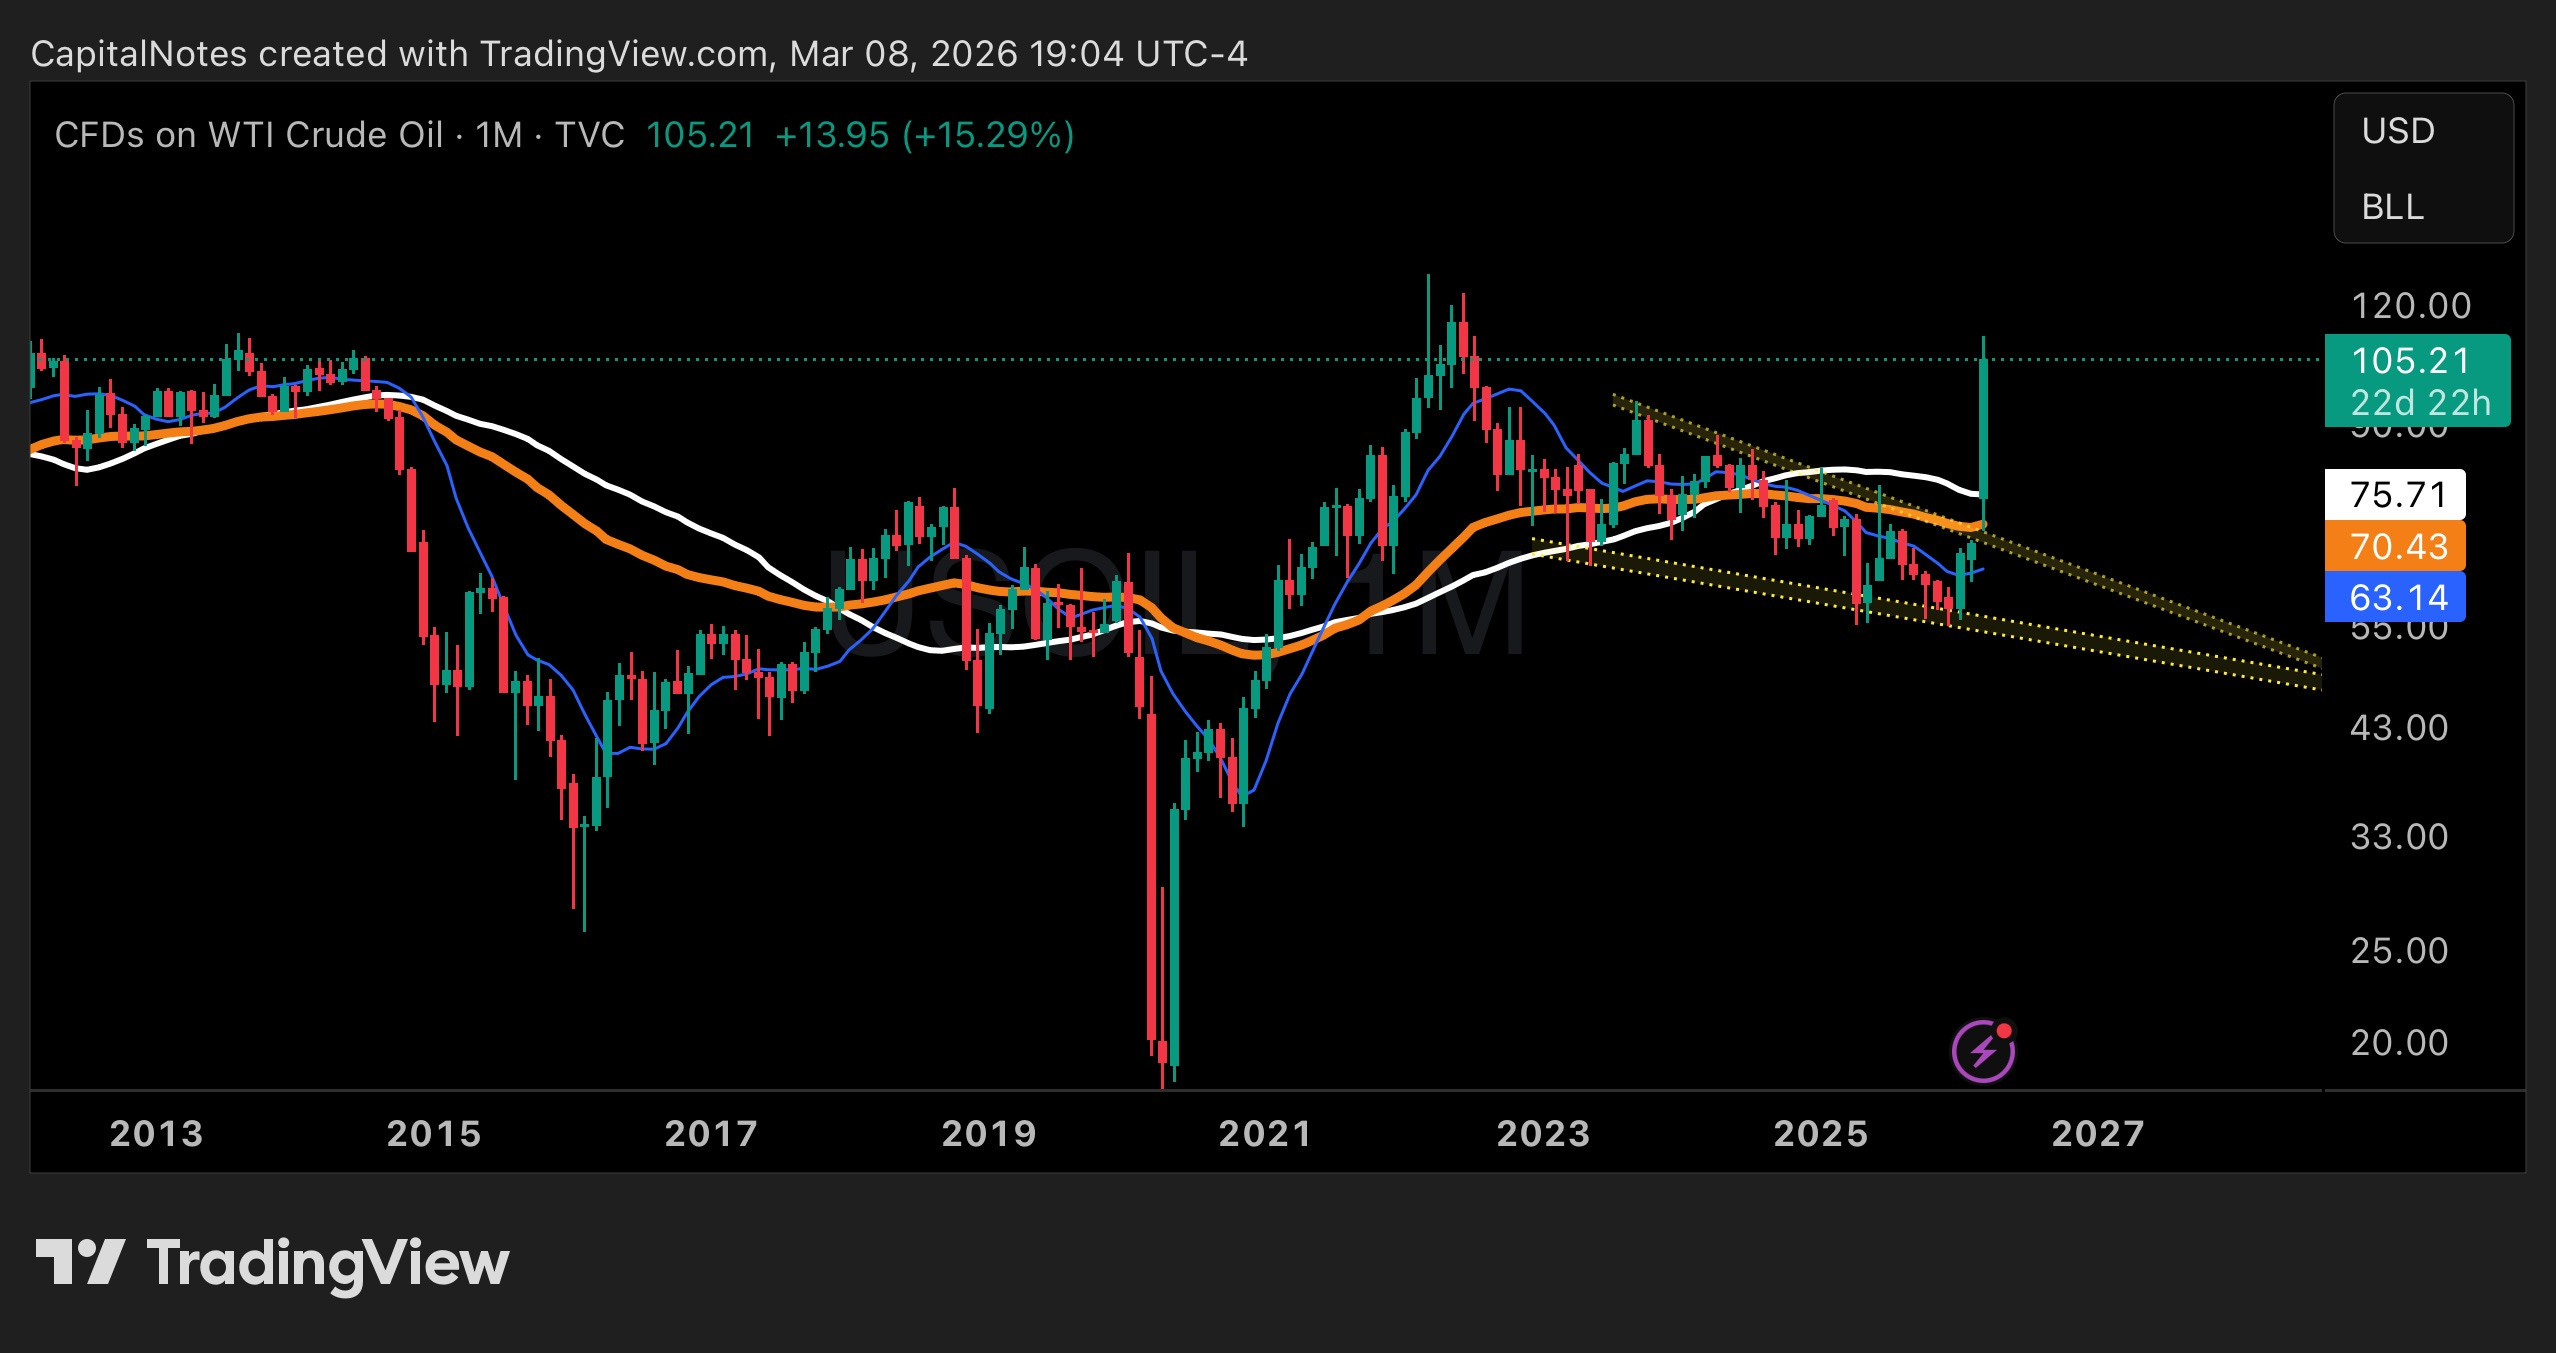
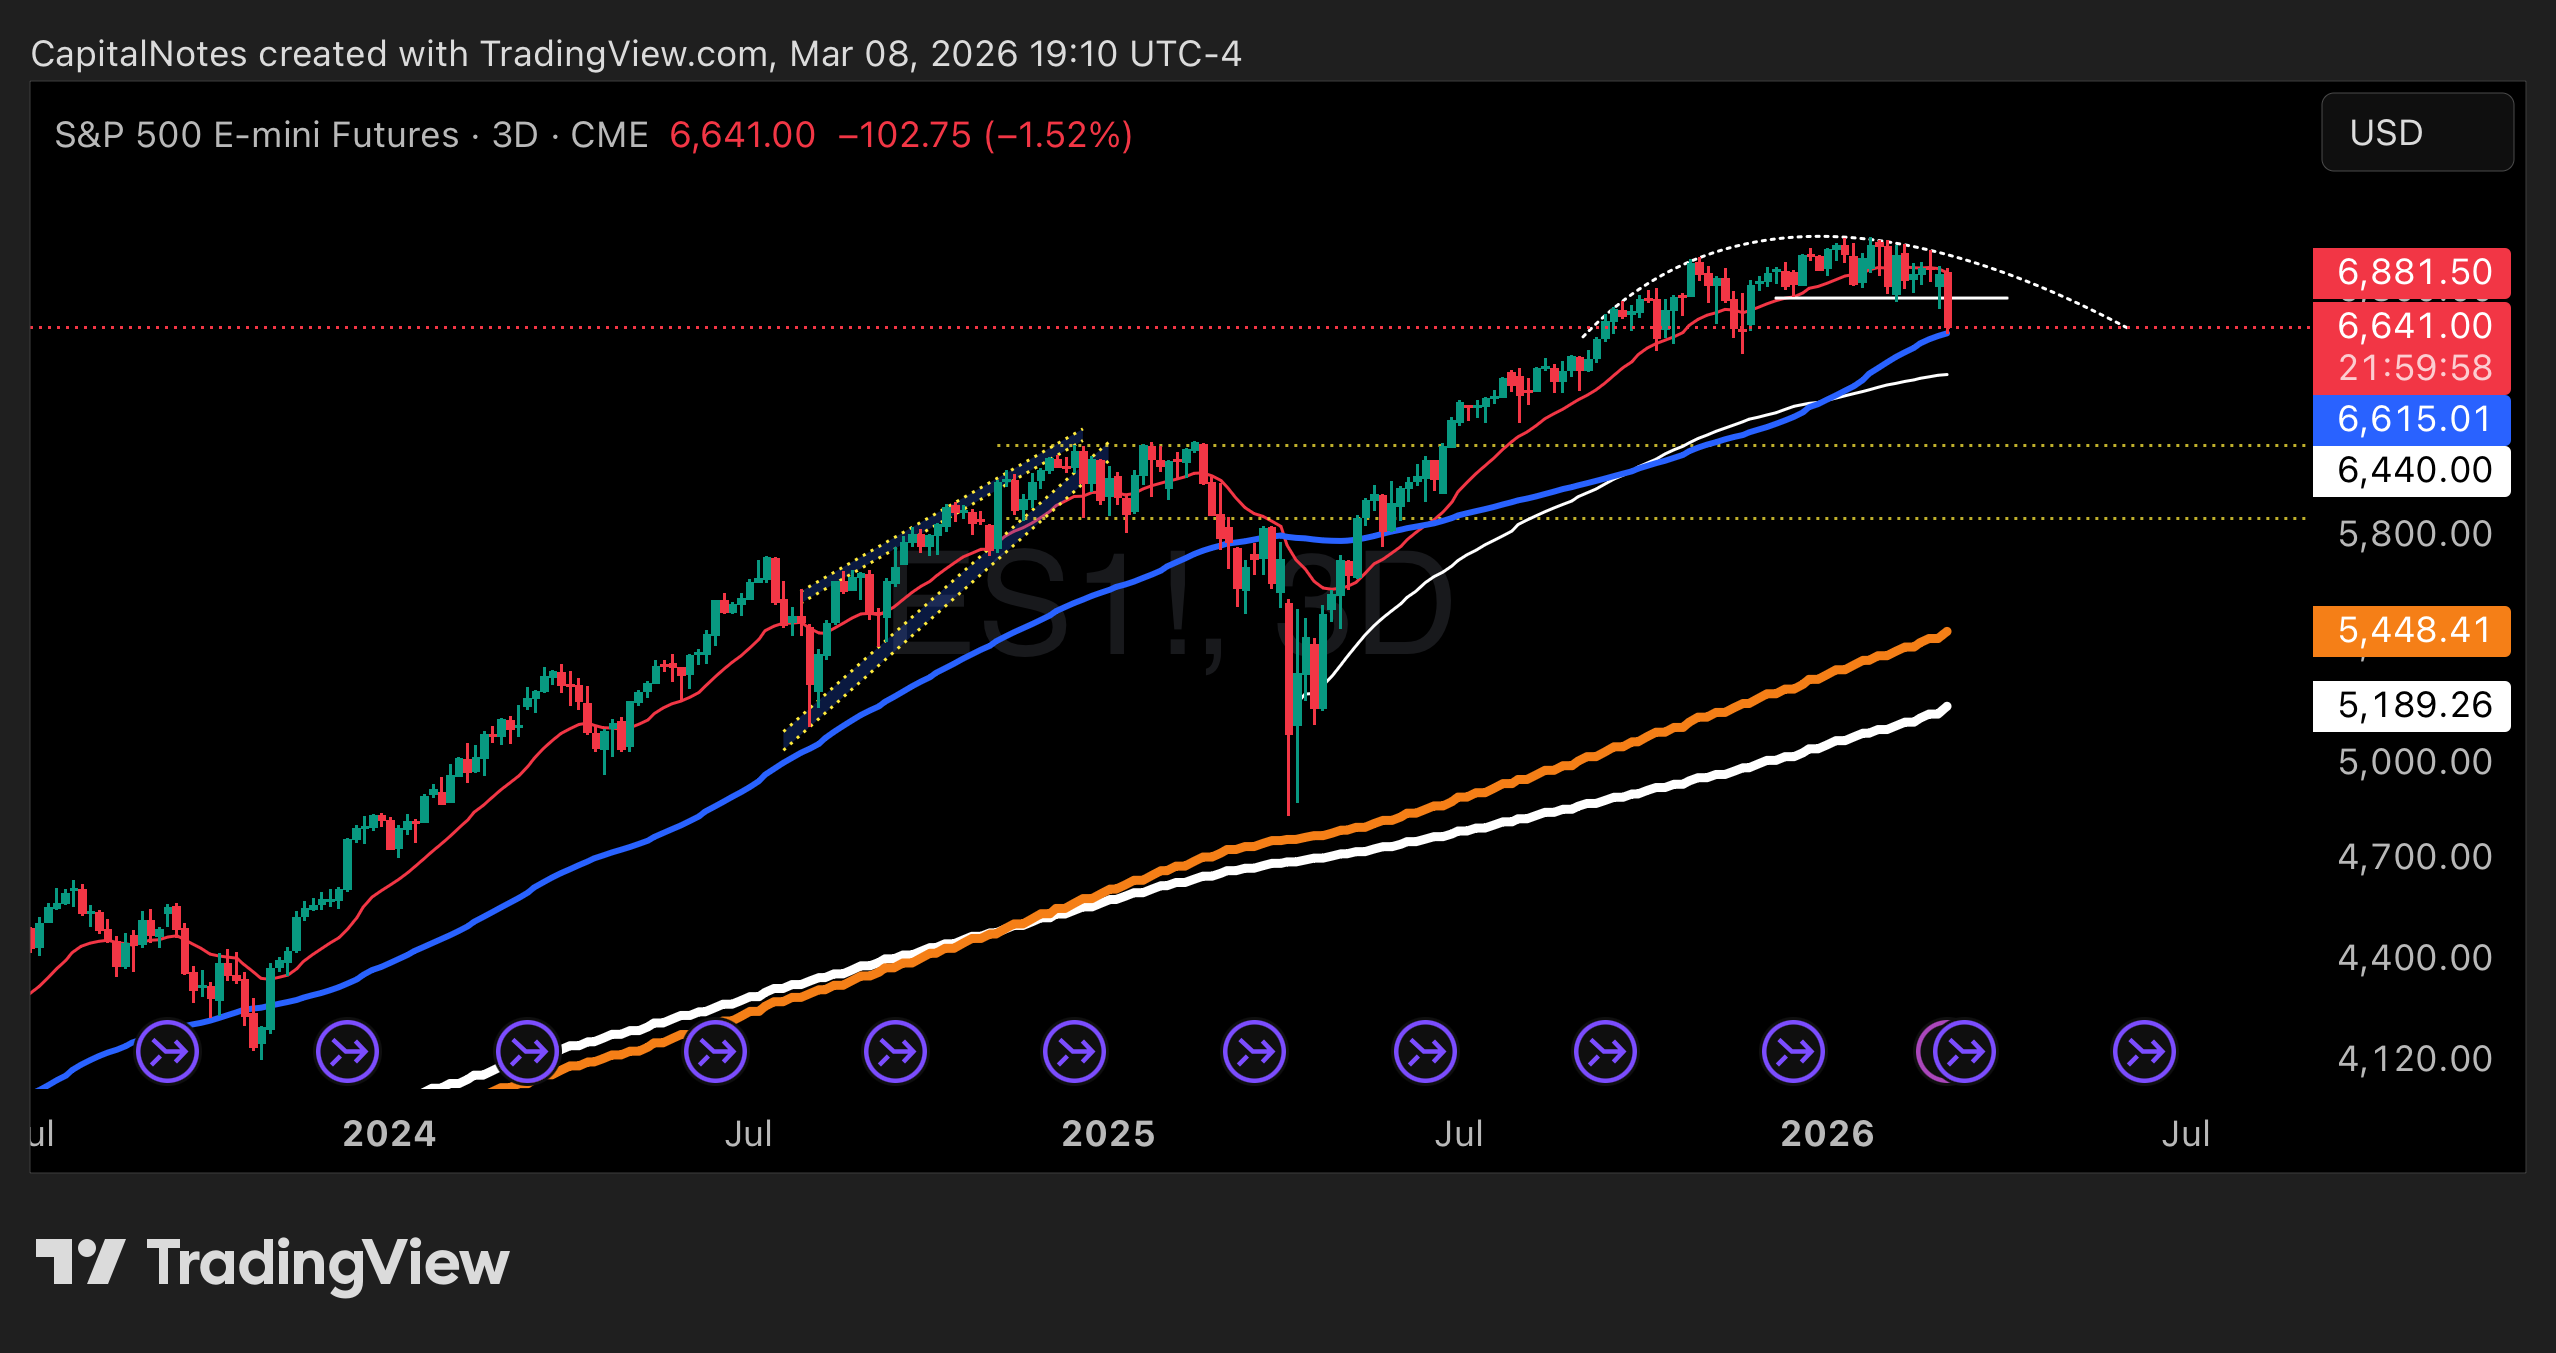
Oil futures surged 50% to $107/barrel in seven days, its biggest weekly gain since futures trading began in 1983. The Strait of Hormuz became a live flashpoint. The VIX blew past 29. South Korea’s Kospi triggered a circuit breaker after its worst two-day crash since 2008. Private credit funds are restricting redemptions. The S&P 500 posted its worst week since the April 2025 tariff panic. And the Atlanta Fed’s GDPNow estimate dropped from 3.0% to 2.1% on Friday alone.
All of this is happening against a backdrop that was already deteriorating: tariffs that have pushed the average effective U.S. import tax to the highest level since the 1930s, a labor market that added the fewest jobs since the pandemic in 2025, and a Federal Reserve stuck between inflation running at 2.9% and an economy that’s visibly slowing. The Fed meets March 17-18, and the market knows they’re boxed in.
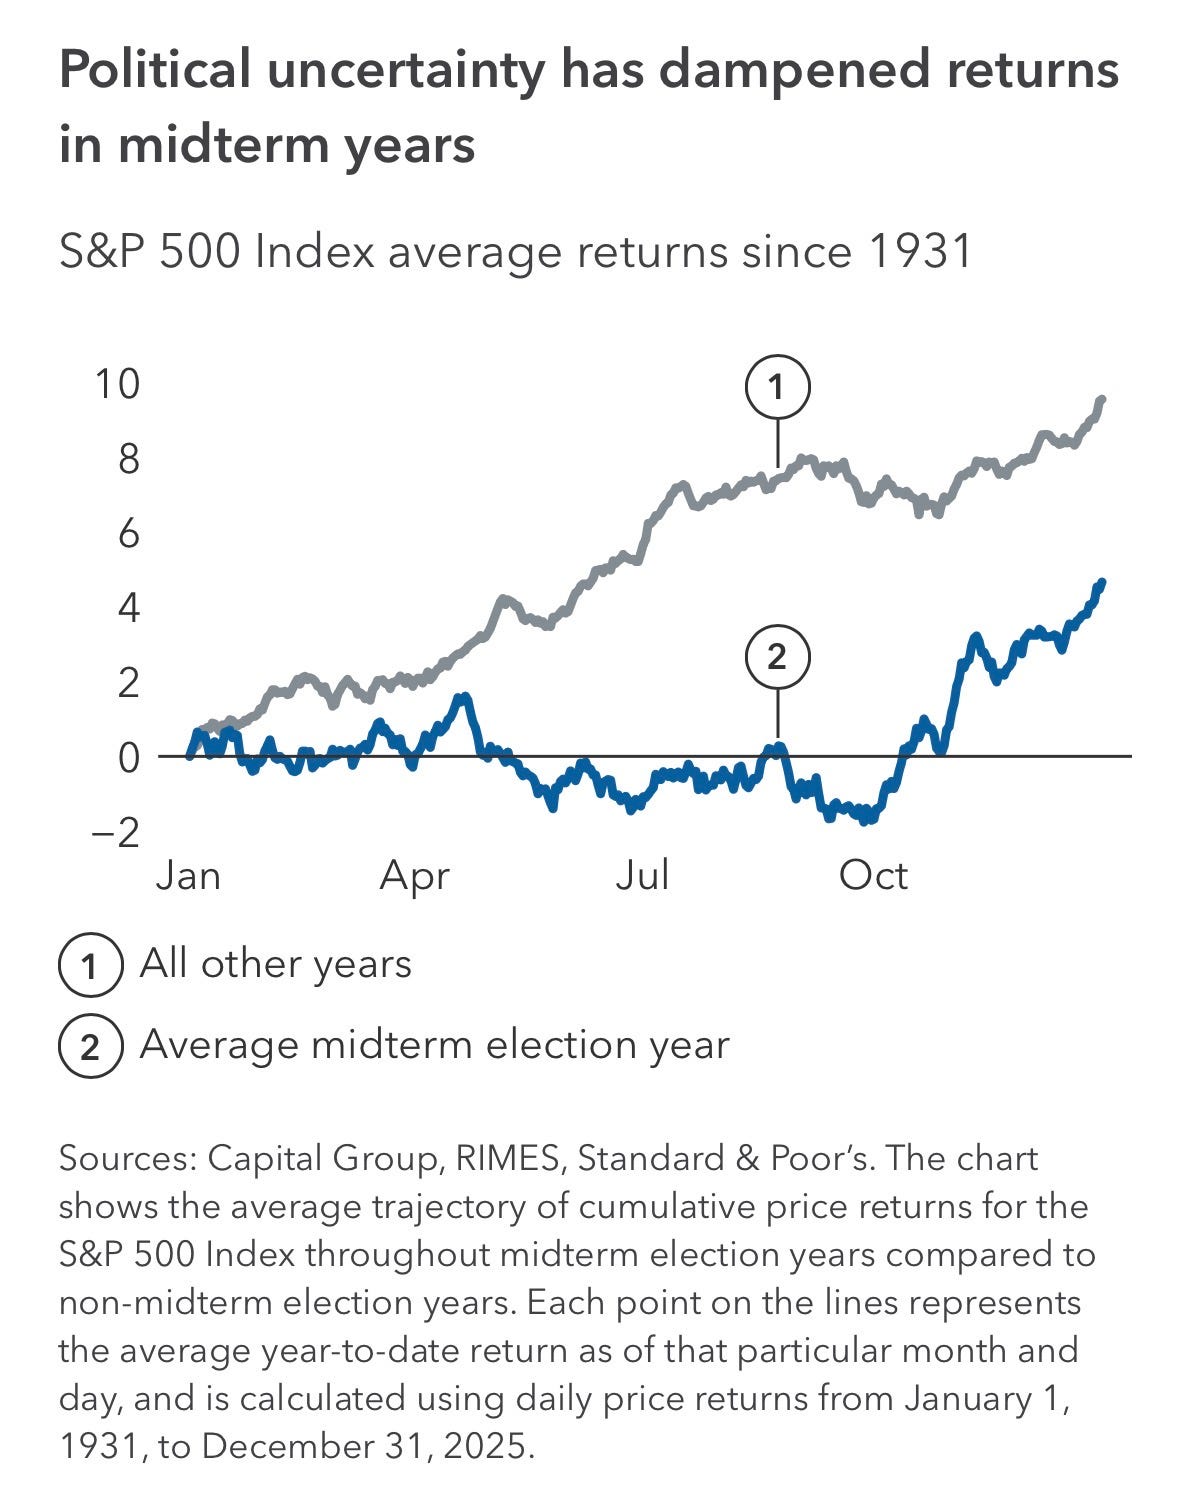
On top of everything else, this is a midterm election year. Historically S&P 500 returns have been far below average in the second year of a Presidency.
In last week’s piece, I pointed out a number of these potential risks:
Since then, most of these downside catalyst have worsened.
I’m a contrarian by nature. So when I see this much fear concentrated in one week, my instinct is to start looking for opportunity. But instinct isn’t enough. I need to see the data.
I spent the weekend running through my full cross-asset dashboard: volatility, credit, sentiment, positioning, breadth, and intermarket leadership. Let’s walk through what I’m seeing, chart by chart, because I think the answer is more nuanced than the “buy the dip” crowd or the “sell everything” crowd wants to hear.
Why short-term analysis matters for long-term investors
I know what some of you are thinking: “I’m a long-term investor, why do I care about any of this?”
Because the single most destructive thing a long-term investor can do is panic at the wrong time and interrupt the process of compounding. That’s it. That’s the whole game.
Knowing when to expect volatility can be a superpower to a rational investor. If you expect something to occur it is no longer surprising. The purpose of this analysis isn’t to time the market. It’s to prepare you psychologically so that you can make logical decisions when everyone else is making emotional ones.
With that framing, here is the evidence.
The regime has shifted
I’ll start with the big picture. My Risk Master Composite just crossed below zero into RISK OFF territory.
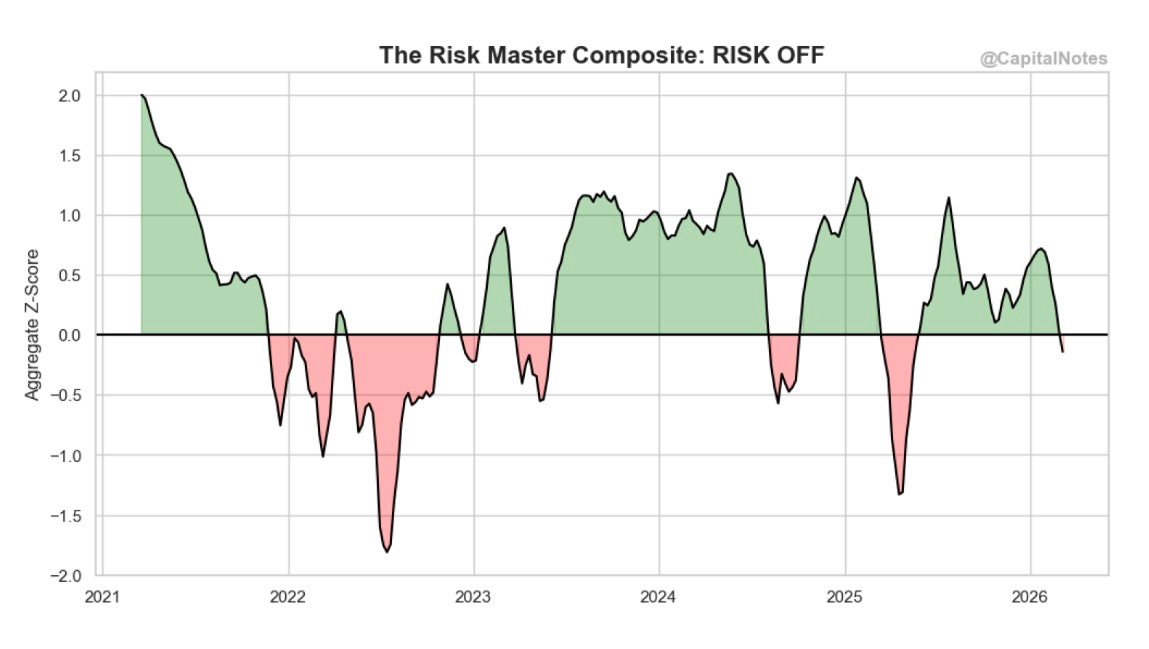
This indicator aggregates z-scores of intermarket and intramarket ratios across equities, fixed income, and currencies. Things like high beta vs low volatility, consumer discretionary vs consumer staples, and other risk appetite proxies. When the composite is green, risk-seeking assets are leading across markets. When it turns red, defensive leadership has taken over.
It just flipped. That’s the market telling you the character of leadership has changed. Risk-on is no longer in the driver’s seat.
But notice: the reading is barely negative. Compare that to the deep plunges in mid-2022 or early 2025. Those were moments when the composite was registering -1.0 to nearly -1.8. If this selloff deepens, there’s room for this indicator to fall much further before we reach the kind of extreme that historically marks a tradeable bottom.
In other words: the regime has shifted, but we may still be in the early innings of the move.
Volatility: waking up, not screaming
Now let’s look at volatility across asset classes.
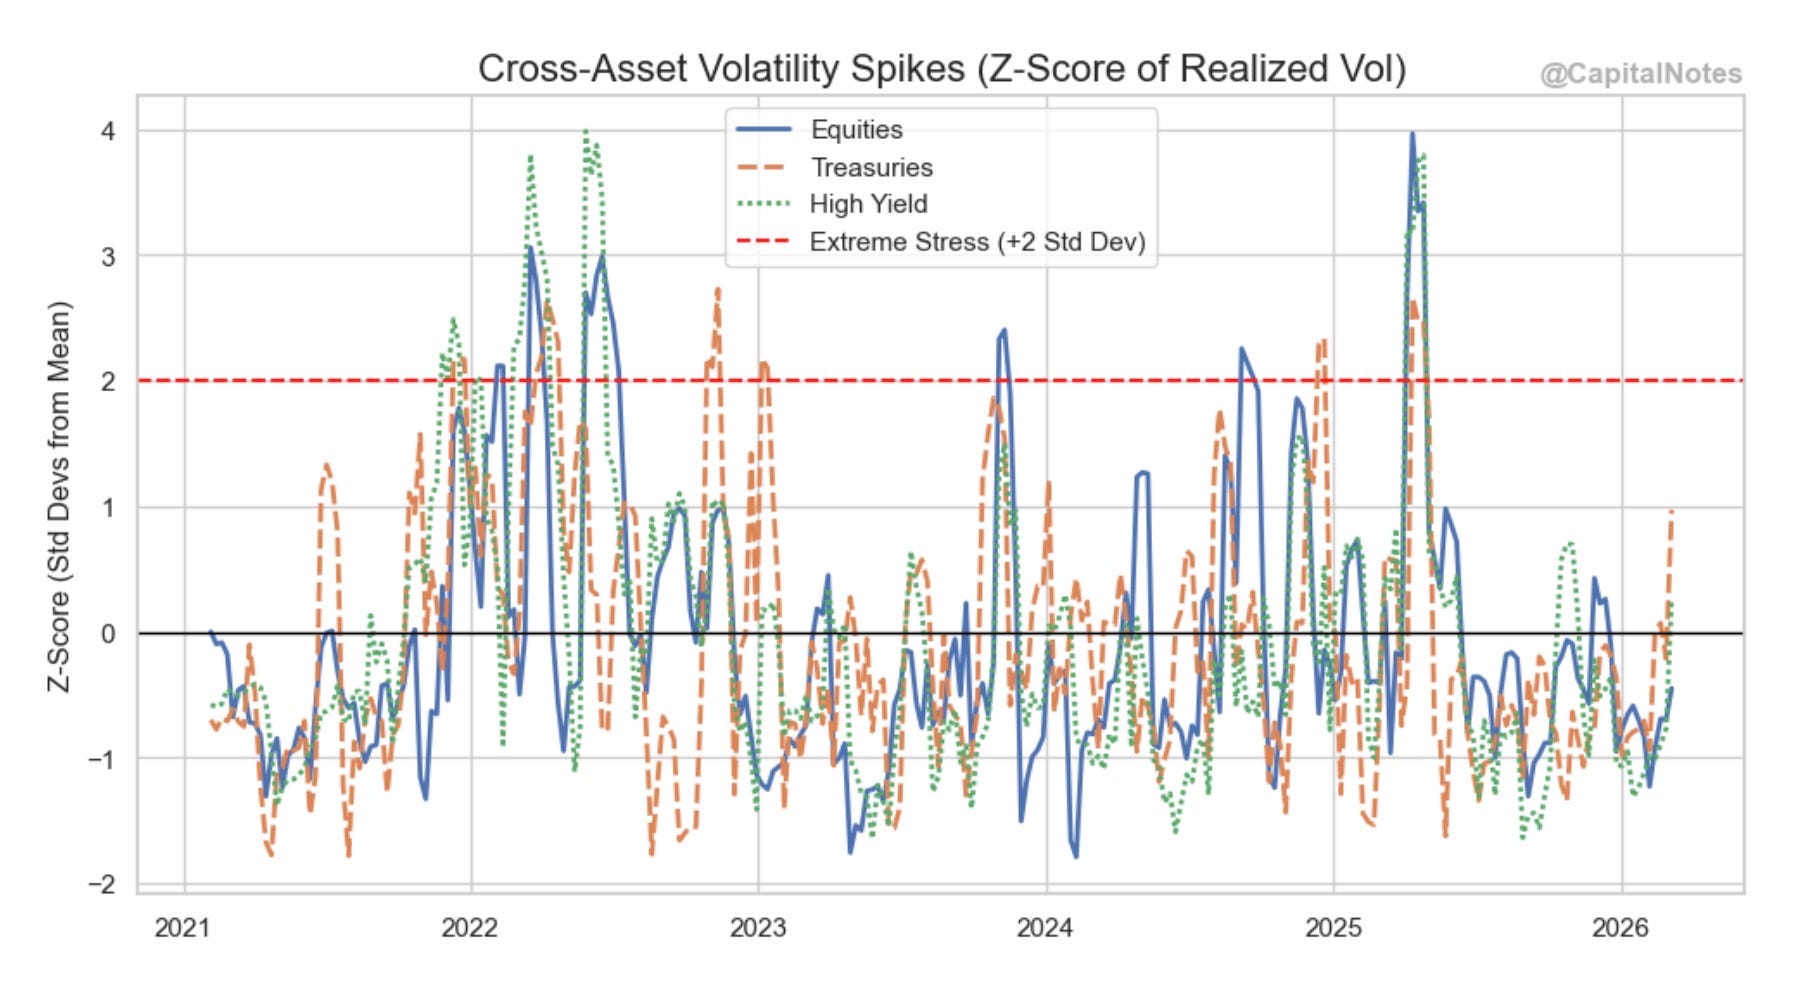
This chart tracks z-scores of realized volatility across equities (blue), Treasuries (orange), and high yield credit (green). The red dashed line at +2 standard deviations marks the “extreme stress” threshold.
Treasuries have just popped above +1 standard deviation, driven by the bond selloff as investors price in the inflationary impact of $100+ oil. High yield has moved above zero. And equities are still below zero but trending higher.
Compare that to mid-2022 or early 2025, when all three were spiking above +2 and even +3 standard deviations simultaneously. We’re nowhere close to that kind of coordinated stress right now.
This is early-stage vol expansion. The environment is shifting, but there’s room for conditions to deteriorate further before we reach the kind of synchronized stress that has historically marked a buying opportunity.
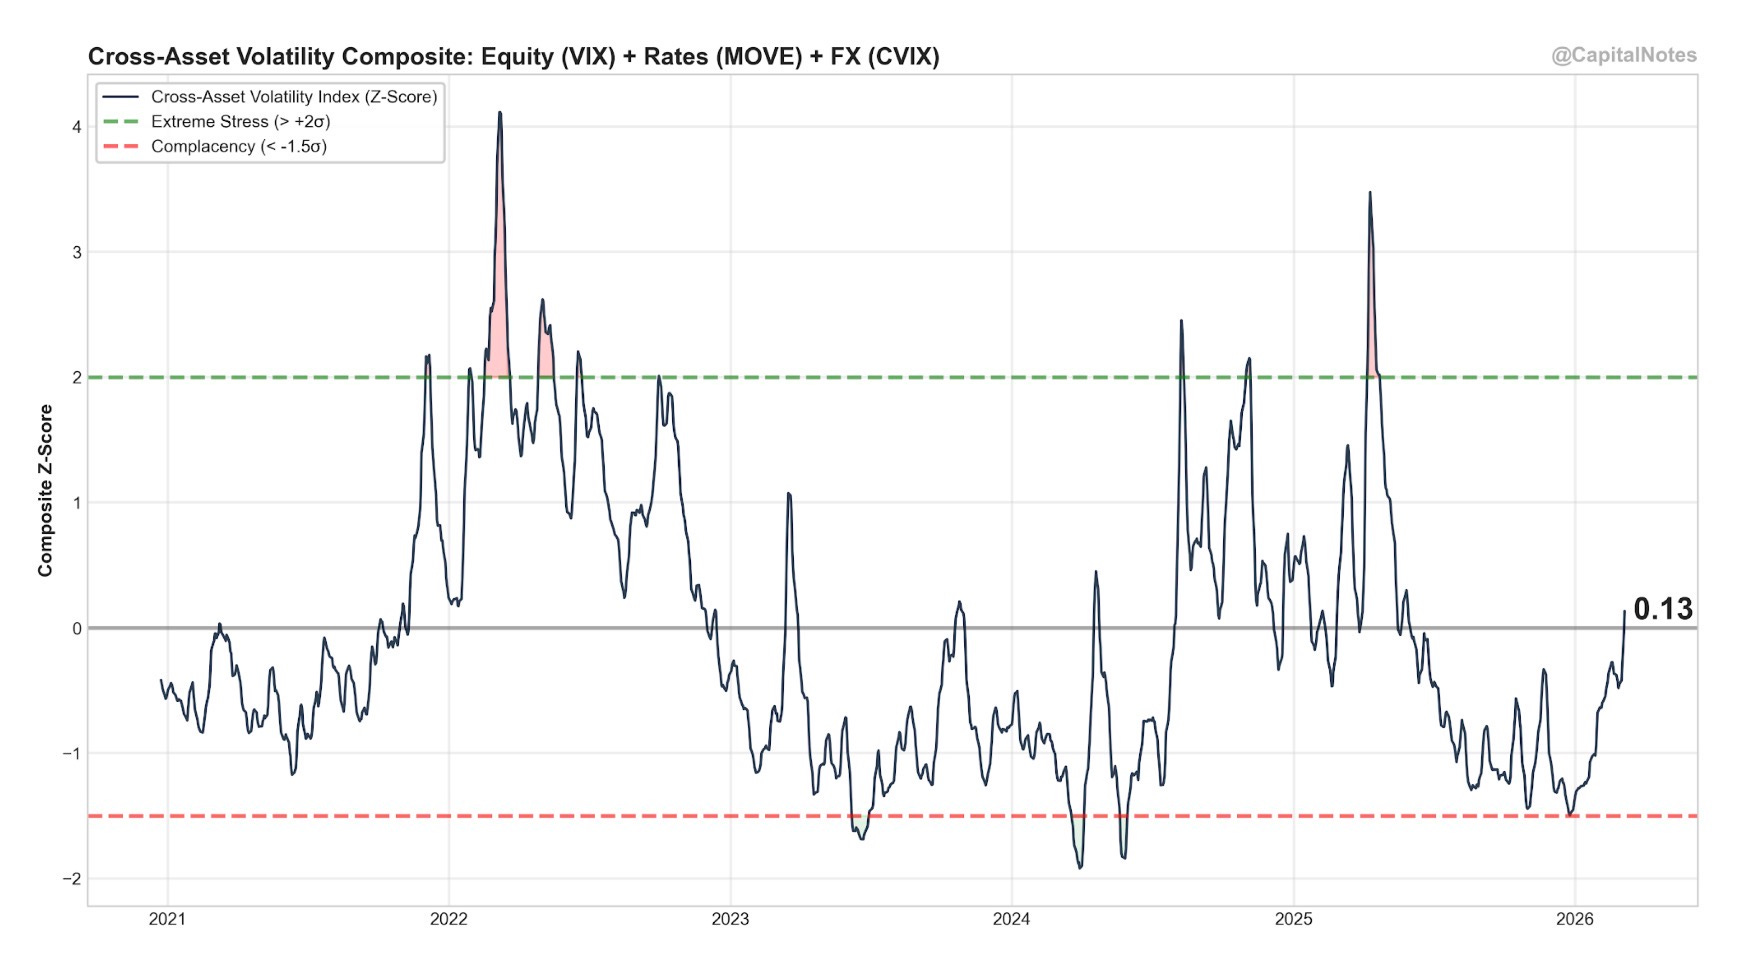
My Cross-Asset Volatility Composite, which combines equity (VIX), rates (MOVE), and currency (CVIX) volatility into a single z-score, currently reads 0.13.
That’s above zero, confirming stress. But it’s well below the +2σ extreme threshold that historically marks the peak of fear. The mid-2022 and early 2025 spikes both touched +3σ before reversing. We’re a long way from that.
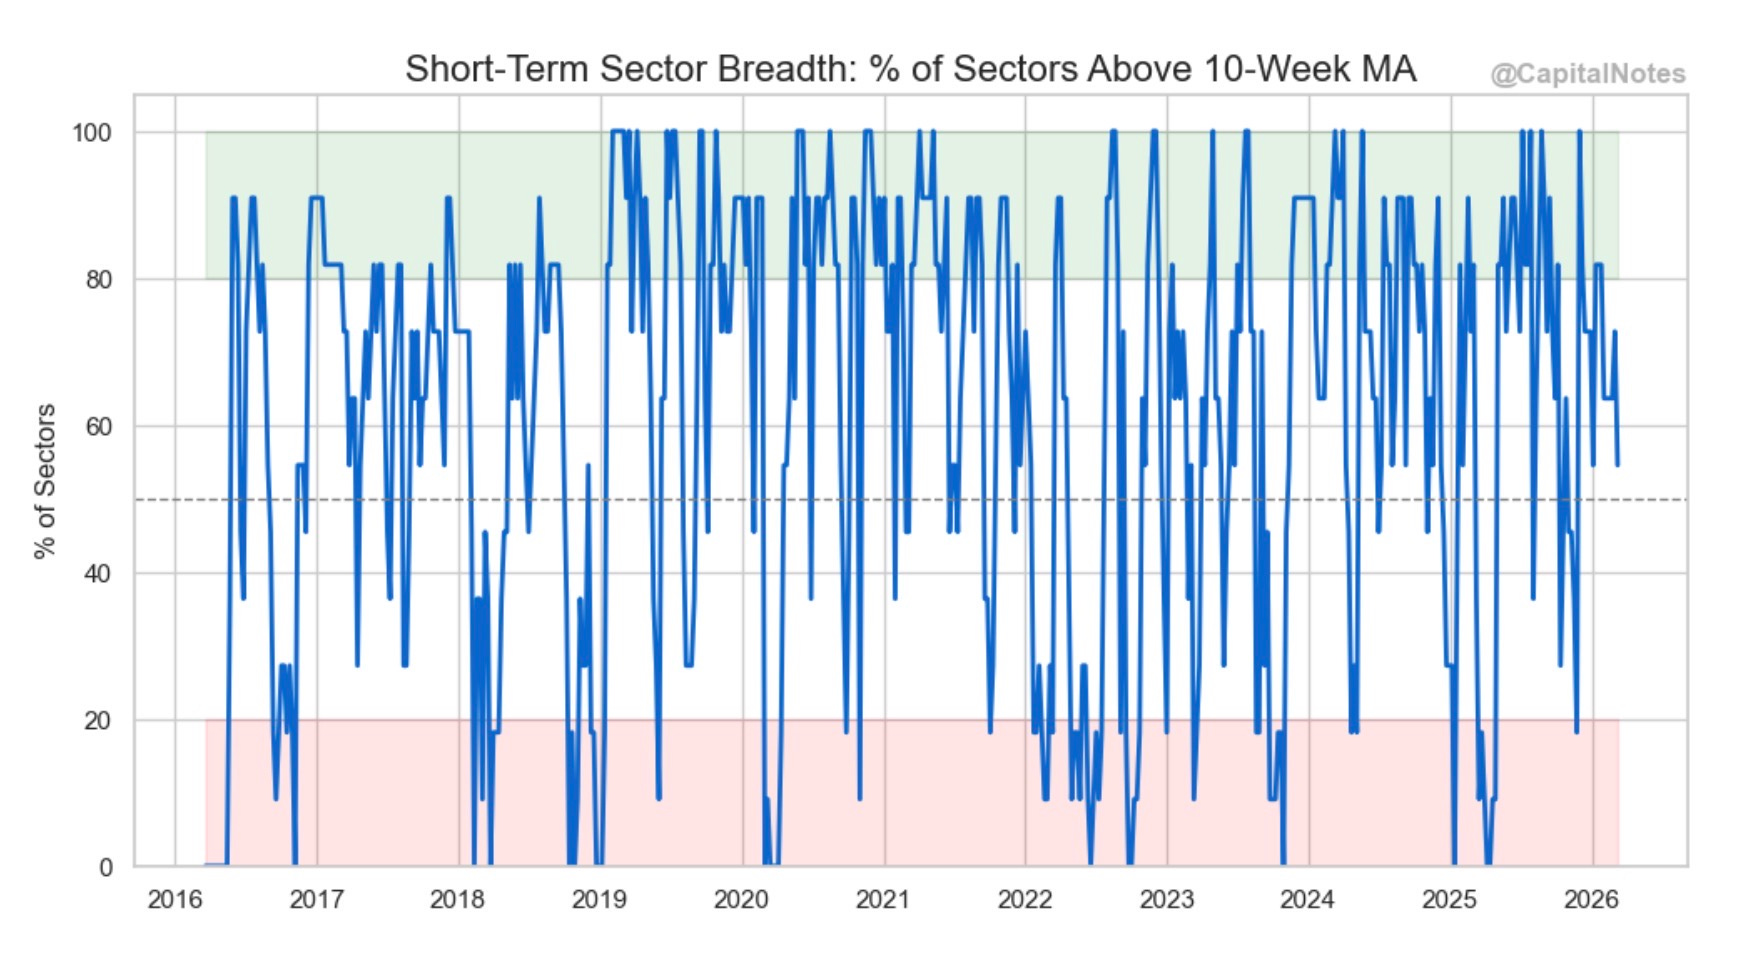
Zooming into the short-term picture, sector breadth measured against 10-week moving averages has declined but remains in the middle of its historical range. This isn’t the kind of washout we saw during prior panic episodes.
The term structure is in panic mode
The volatility term structure is where things get more interesting.
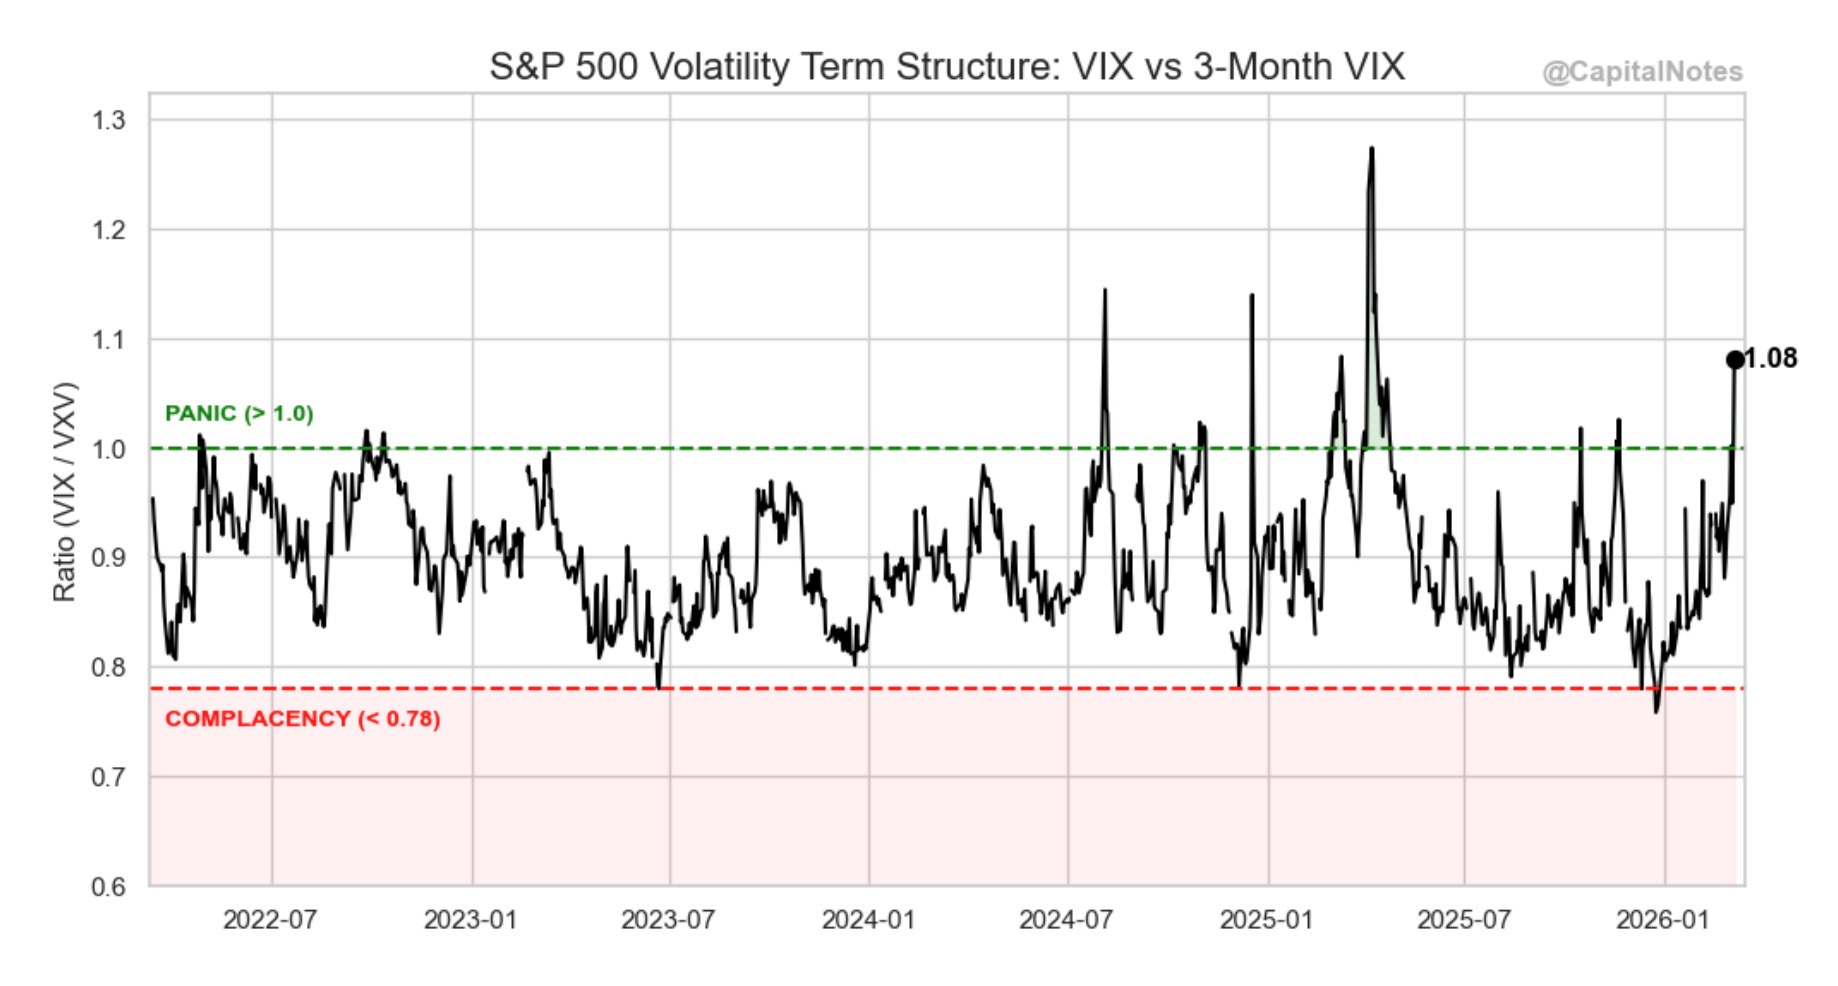
The VIX / VXV ratio just closed at 1.08. Anything above 1.0 signals panic. It means traders are paying more for short-term protection (30-day implied vol) than for longer-dated hedges (3-month implied vol). Fear is concentrated in the here and now.
I track this ratio because it’s one of the better timing tools in my toolkit. But the buy signal isn’t when this ratio spikes above 1.0. It’s when it crosses back below 1.0. That’s when the panic starts to subside and the risk/reward for adding equity exposure improves.
We’re not there yet. The ratio needs to come back down through 1.0 before I’d consider this a green light.
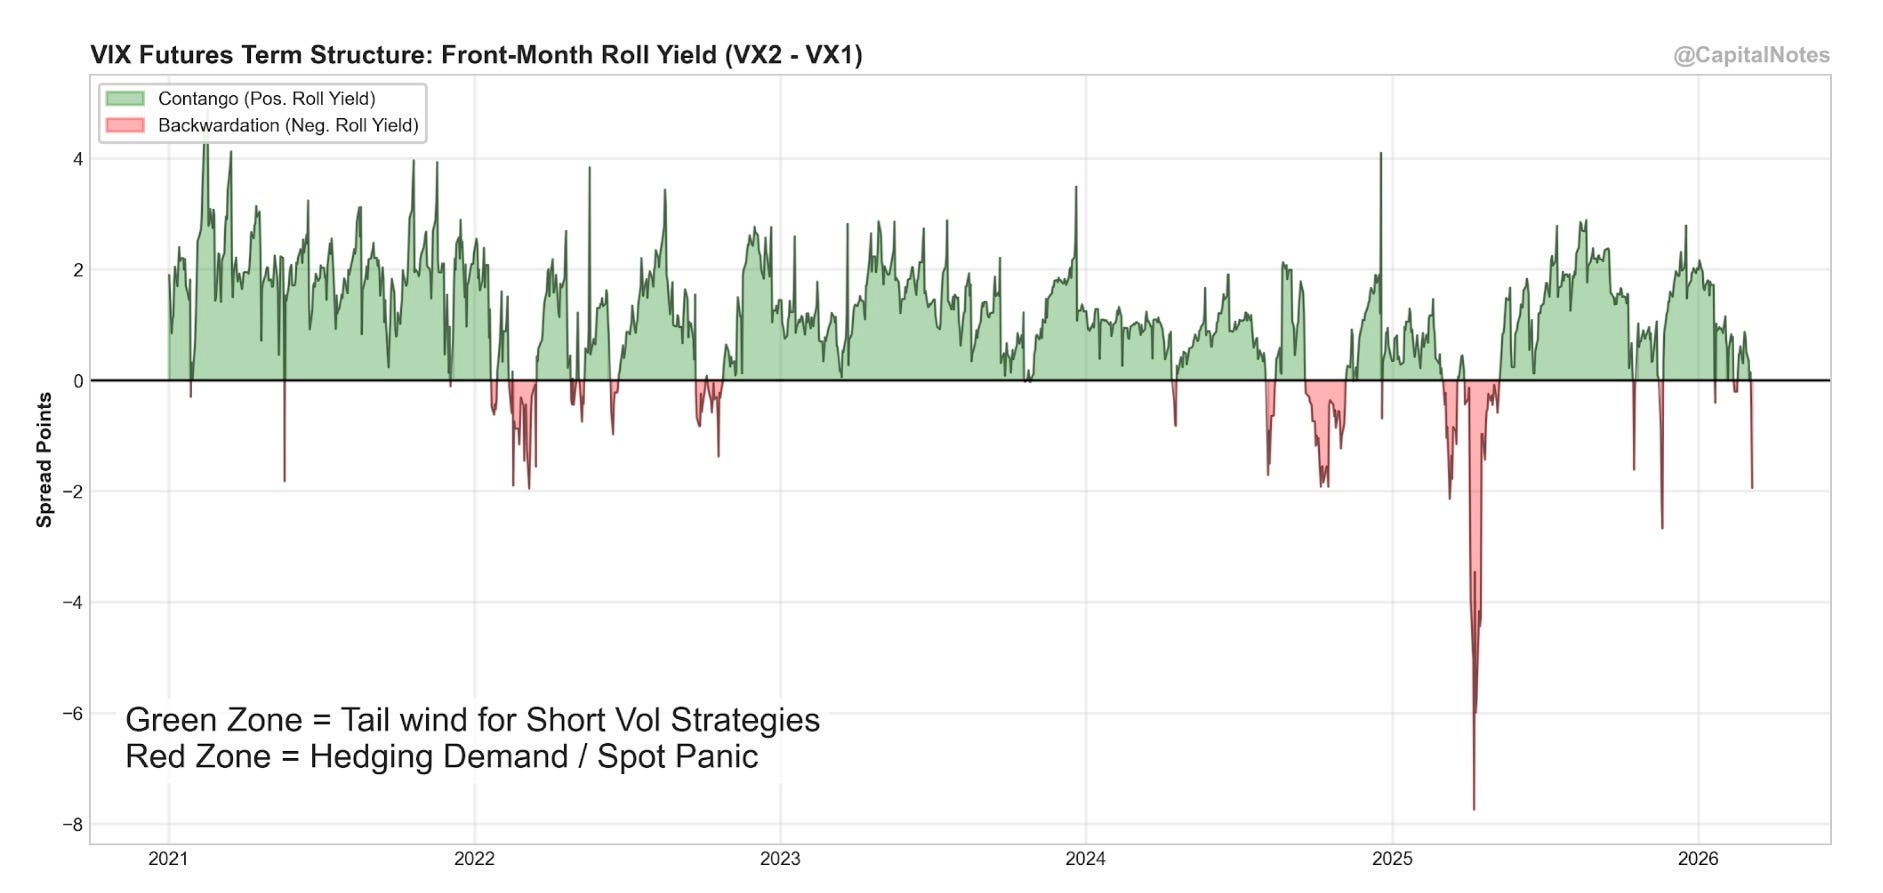
VIX futures roll yield has flipped negative (backwardation), meaning front-month futures are priced above second-month. The red zone on this chart represents hedging demand and spot panic.
The current backwardation is present but shallow compared to the extreme spike in early 2025. That tells me short-term panic is real, but it hasn’t reached the crescendo that marks the best buying opportunities.
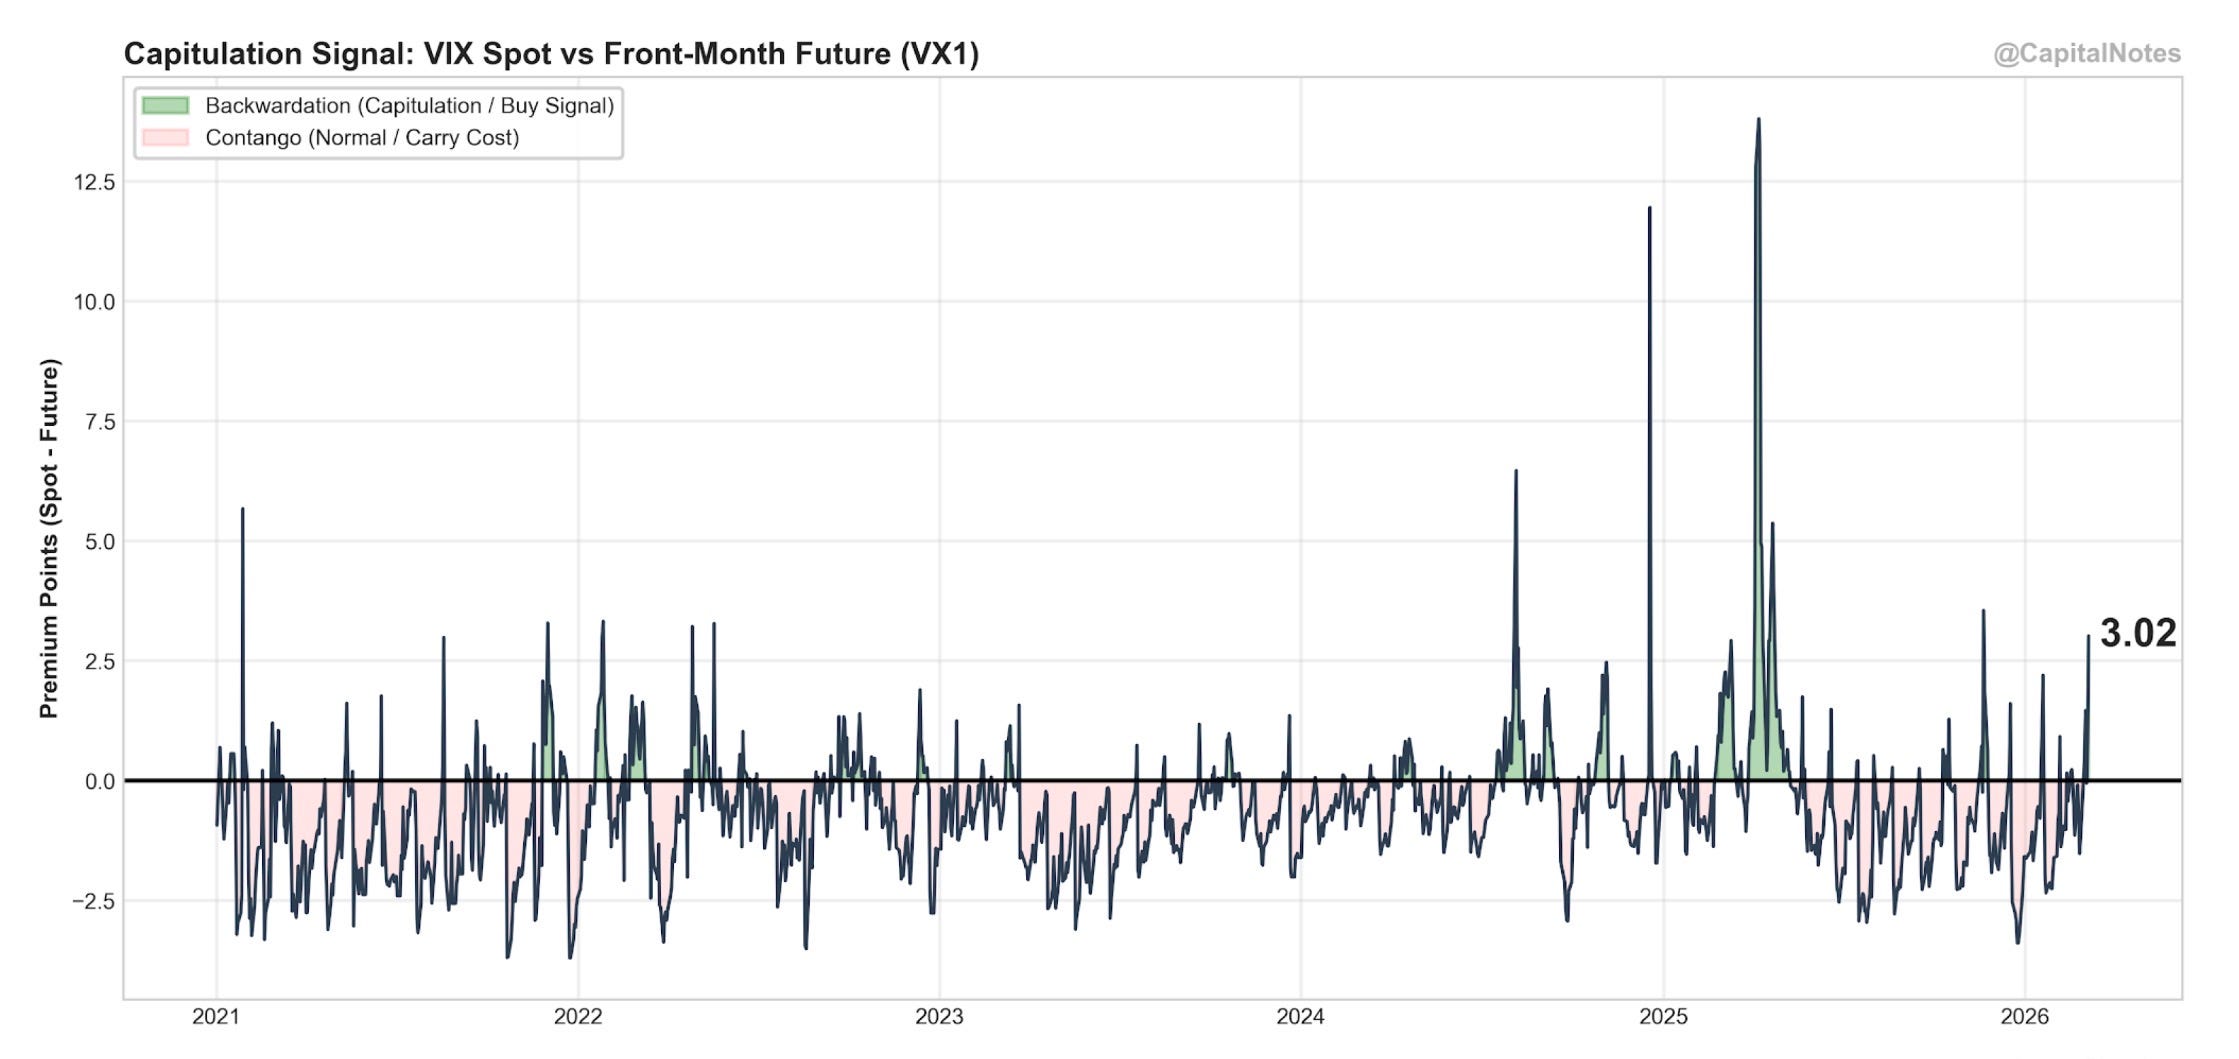
The VIX spot is trading at a 3.02 point premium to front-month futures. That’s significant backwardation. Historically, these spikes in the spot premium have often coincided with or preceded short-term bottoms.
This is one of the more constructive signals in the current data. It suggests short-term fear may be reaching a local extreme. It’s not a perfect timing tool, and it can stay elevated for longer than you’d expect, but it tells me we’re closer to a short-term washout than the broader vol composite might suggest.
Credit: the most important question right now
If there is one chart in this post that deserves the most attention, it’s this one. The equity market can panic about anything. Credit markets panic about solvency. When credit confirms the equity selloff, you have a real problem. When it doesn’t, you’re likely looking at a correction, not the start of something systemic.
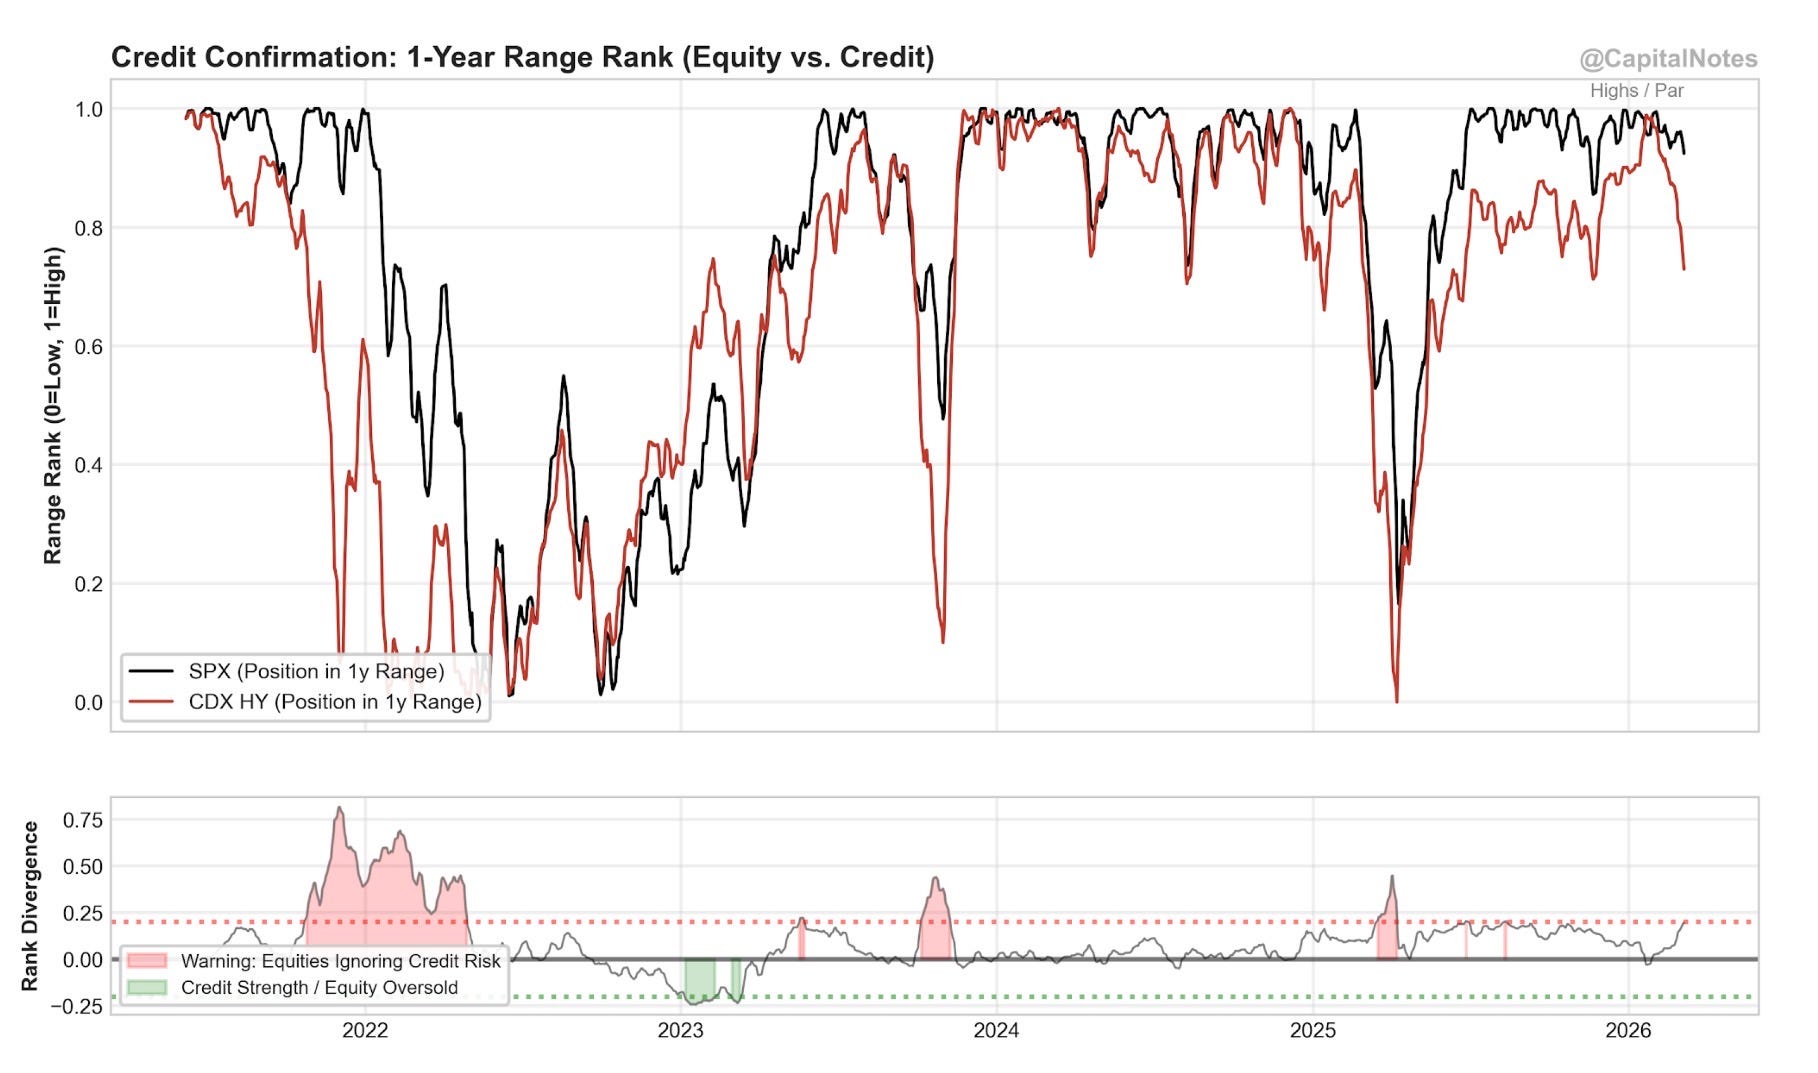
The top panel shows the 1-year range rank for both the S&P 500 (black) and CDX High Yield (red). Both have pulled back from their highs, with credit leading the way, but credit hasn’t yet collapsed the way it did in 2022.
The bottom panel is the divergence between the two. We’re not yet flashing a major “equities ignoring credit risk” warning (pink shading). Historically, equity selloffs that are NOT confirmed by credit deterioration have been buyable corrections. Not the start of something worse. This one is now on the edge.
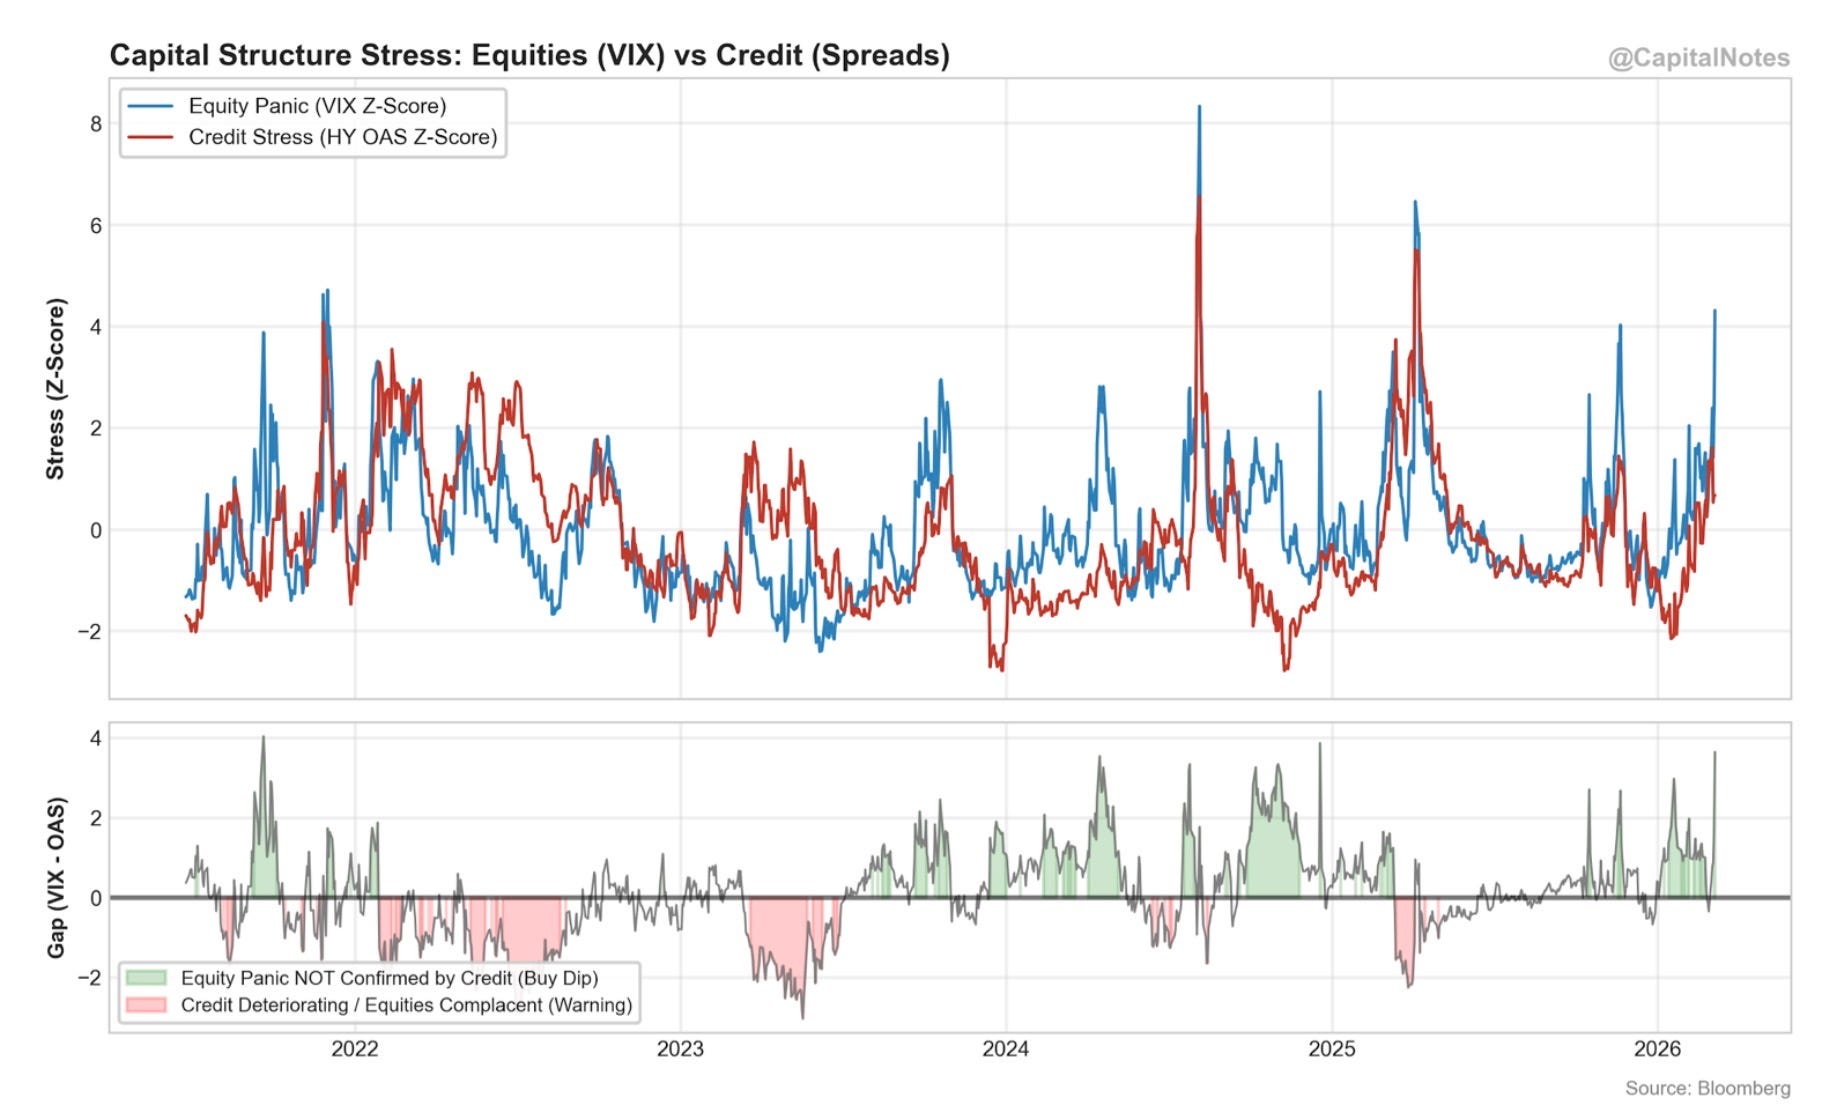
Capital structure stress tells a similar story, but not as negative. The VIX z-score (blue, equity panic) has spiked, while the HY OAS z-score (red, credit stress) has moved up but remains more contained.
The bottom panel shows the gap between the two. The green shading represents episodes where equity panic ran ahead of credit stress. Historically, these have been “buy the dip” setups, not the beginning of a credit event.
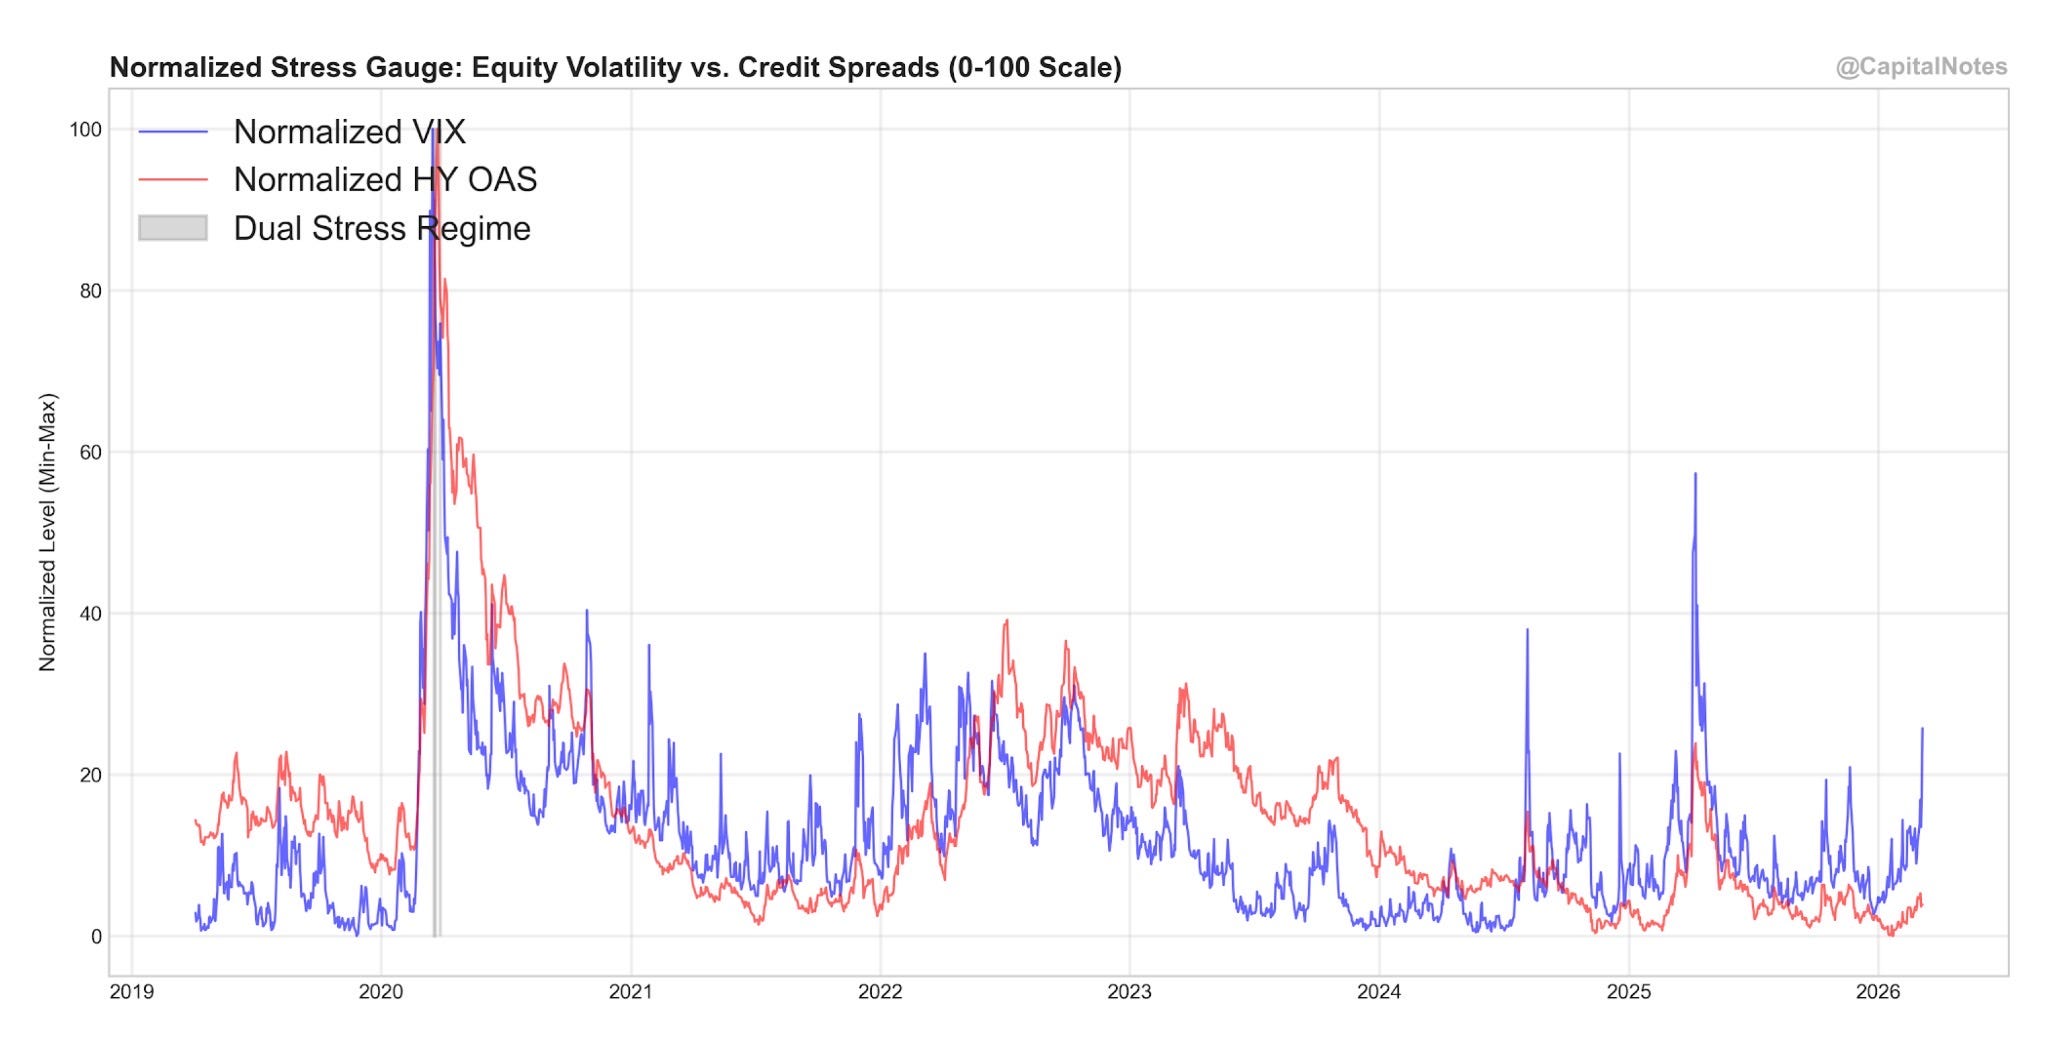
Normalizing both the VIX and HY OAS on a 0-100 min-max scale makes the divergence even clearer. The VIX has spiked, but credit spreads remain relatively well-behaved. No “dual stress regime” (gray shading) has been triggered in this view. The last time we saw a true dual stress event was the spring 2025 “Liberation Day” panic.
Sentiment and positioning: nervous, not despondent
The AAII Bull-Bear spread has come down from its earlier bullish levels but hasn’t reached the 10th percentile (-27.4%) that marks extreme pessimism. Retail investors are nervous. They’re not yet despondent.
Active managers tell a similar story. The NAAIM Exposure Index has pulled back but remains well above the capitulation zone (below 43). Compare the current reading to mid-2022, when NAAIM briefly dipped below 20. That was capitulation. That was a “back up the truck” moment. We’re not there.
In my opinion, for this to be a true contrarian buying opportunity of the highest quality, I’d want to see retail investors despondent and active managers at or near capitulation. We’re heading in that direction. But we haven’t arrived.
Breadth: damaged, not broken
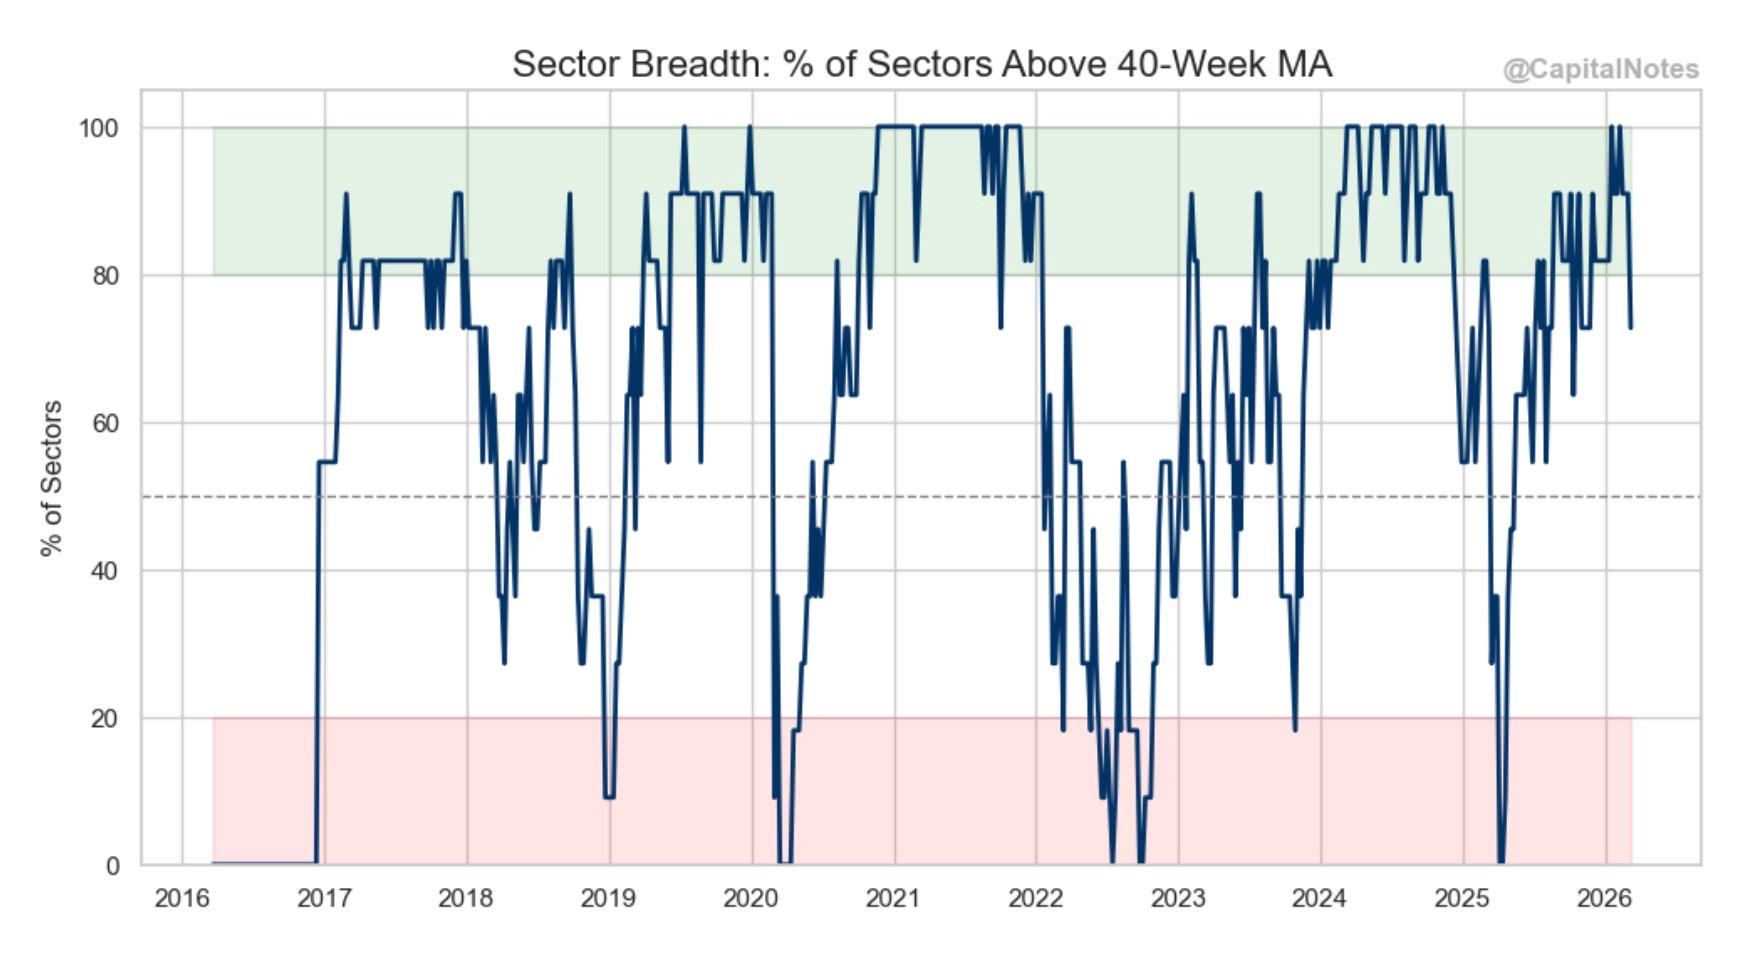
The percentage of sectors trading above their 40-week moving average has dropped sharply. But it hasn’t fallen into the pink “danger zone” below 20% that coincided with the 2020 crash, the 2022 bear market, and the mid-2025 tariff panic.
We’re in the upper middle part of the range. That’s consistent with a correction, not a bear market. This reading can go either way from here.
Variance risk premium: a quick check
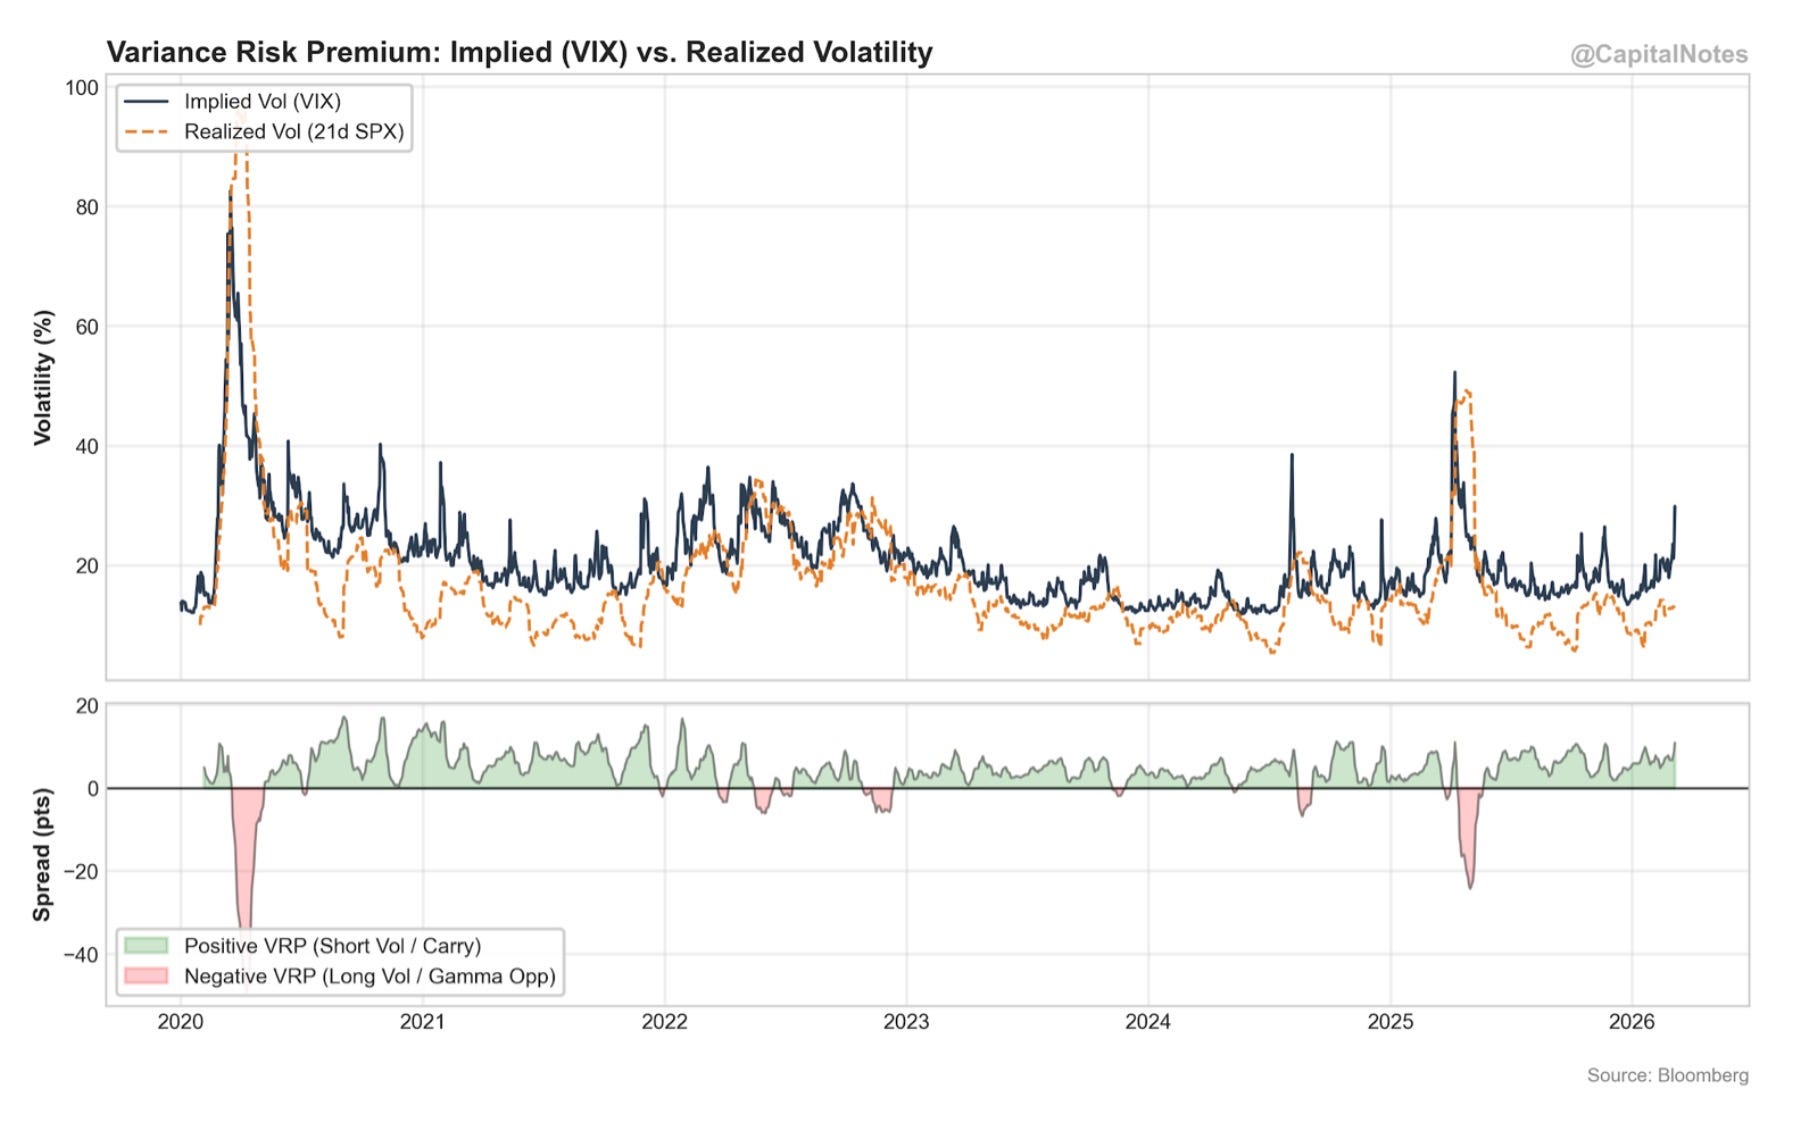
The variance risk premium (the spread between implied and realized vol) briefly went deeply negative in early 2025, meaning realized vol exceeded what the options market was pricing in. That’s rare and it’s painful for anyone short volatility.
Currently, the VRP remains normal. Implied vol (VIX) is running above realized vol, which means the options market is pricing in the possibility of more downside but actual price action hasn’t caught up to those fears yet. This is consistent with the broader picture: fear is elevated, but the damage hasn’t been as severe as the options market is anticipating.
The flash crash gauge
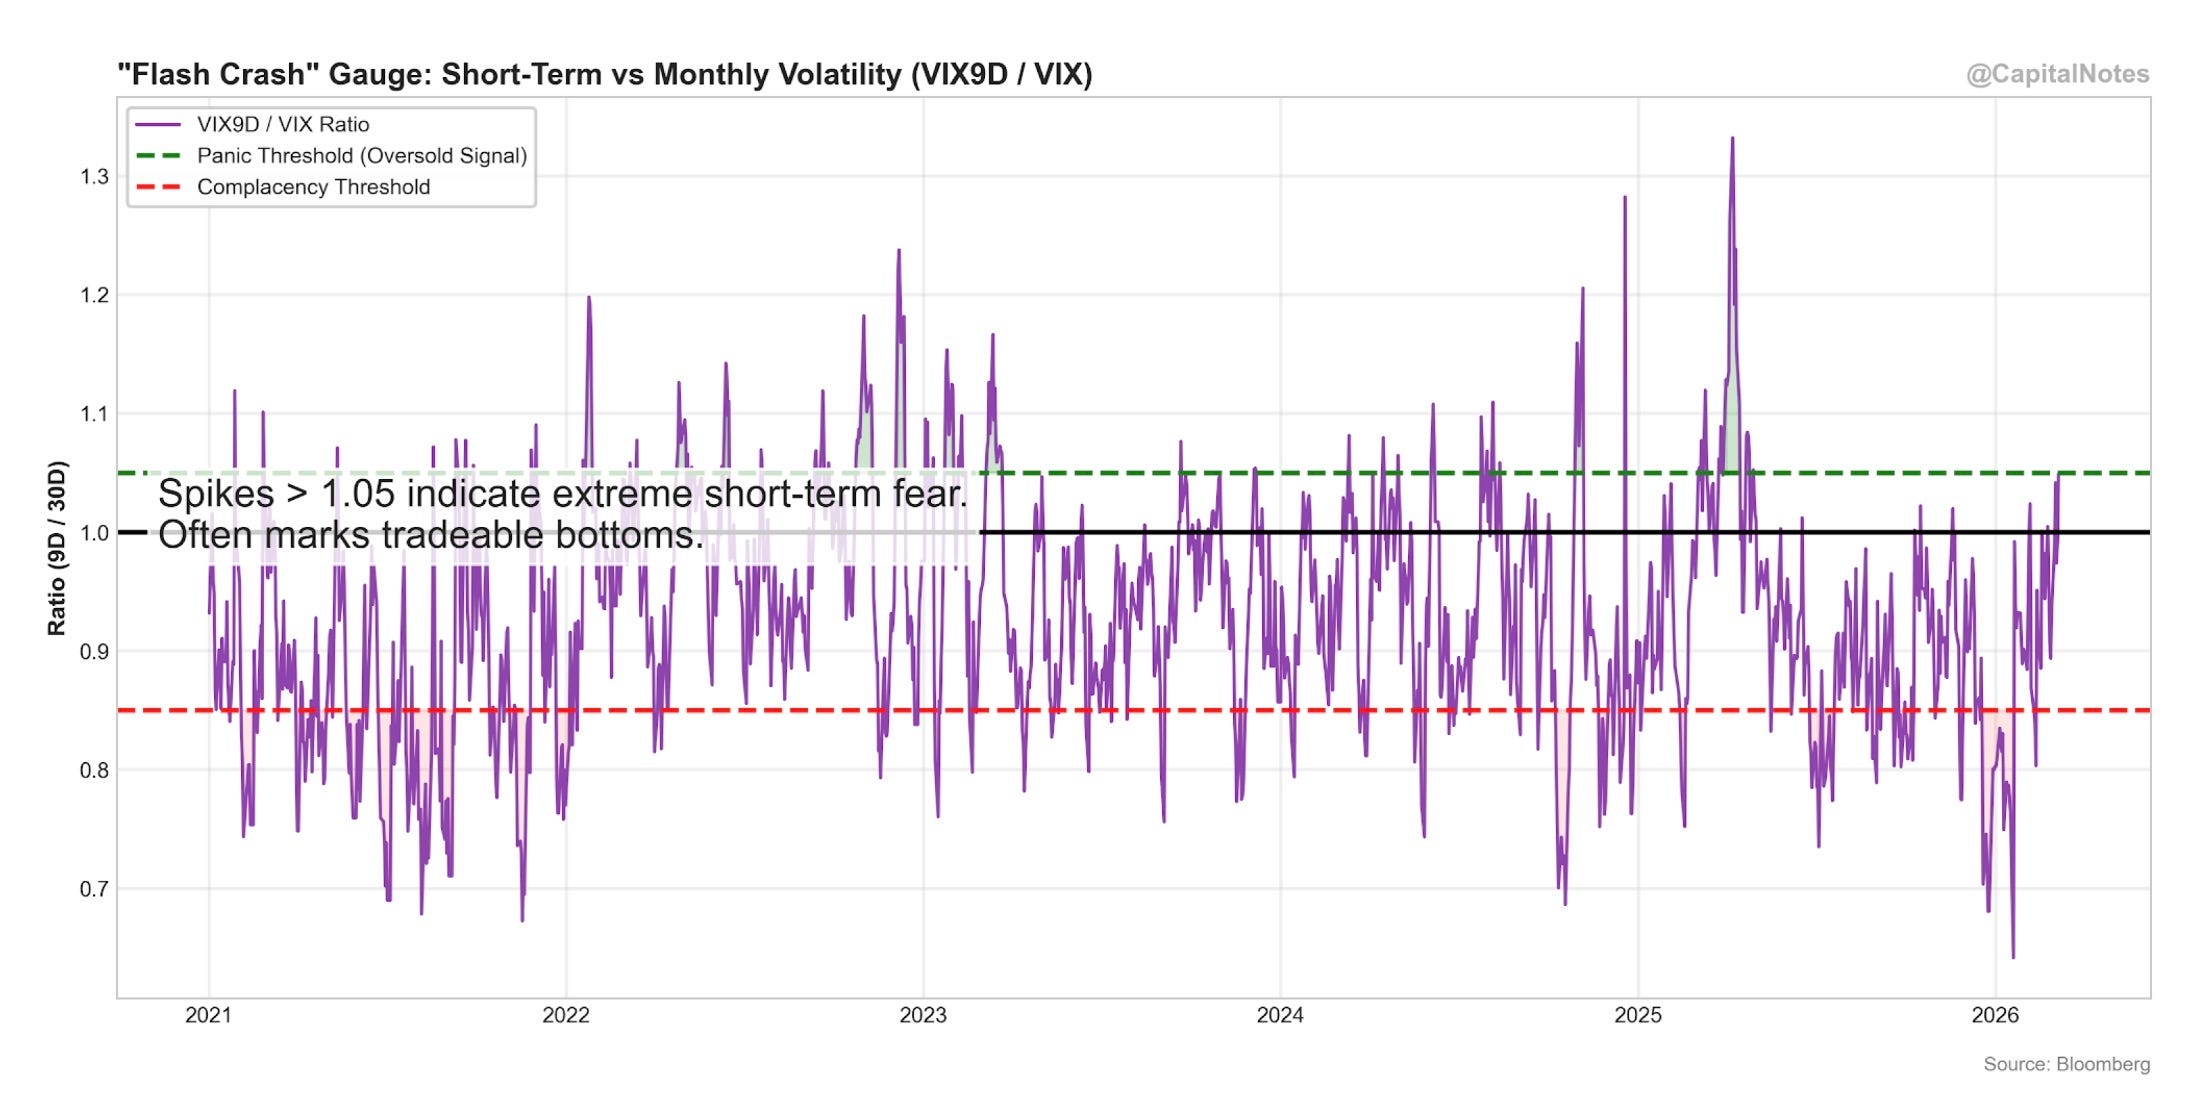
One more vol metric. The ratio of 9-day VIX to 30-day VIX is hovering near 1.0. When this ratio spikes above 1.05, it indicates extreme short-term fear and often marks tradeable bottoms. Below 0.85 signals complacency.
We’re right at the panic threshold. Not complacent. Not in full on panic. Watching this one closely for a significant spike above 1.05 as a potential signal that the short-term washout is peaking.
Conclusion
So where does the data leave us?
The regime has shifted. My Risk Master Composite just crossed into RISK OFF. Volatility is expanding but hasn’t reached coordinated extremes across asset classes. The term structure is in panic mode with the VIX/VXV ratio above 1.0 and futures in backwardation. But credit isn’t fully confirming a systemic event, yet. Breadth has weakened but hasn’t broken. And sentiment, while deteriorating, hasn’t reached the kind of despondent extremes that have historically marked the best buying opportunities.
I’m not predicting a crash. I’m not predicting the bottom is in. I think we’re in that tricky middle ground where short-term panic is real enough that well-planned, logical, selective buying can begin for long-term investors. But the data doesn’t yet support going all in.
The Iran conflict could escalate or de-escalate. Oil, now at $100+, could push inflation expectations higher and force the Fed’s hand. The March 17-18 FOMC meeting adds another layer of uncertainty. And in midterm election years, the typical pattern is for volatility to persist longer than investors expect. The downside could extend from here before a higher-quality long setup presents itself.
If I’m wrong and this is just a garden-variety 5-8% correction in a bull market, then selective buying here will look smart in hindsight. If I’m right that there’s more downside ahead, then patience will be rewarded with even better entry points. Either way, deploying capital selectively rather than aggressively is the right play when the data is this mixed.
Be patient. Be selective. And if you’ve been doing your homework, this volatility is exactly the kind of environment you’ve been preparing for. If you expect something to occur it is no longer surprising.
Let’s see what happens.
— Brant
If you found this analysis useful, please like, subscribe, and share. Your readership is much appreciated.
Disclaimer: The content provided on the Capital Notes newsletter is for general information purposes only. No information, materials, services, and other content provided in this post constitute solicitation, recommendation, endorsement or any financial, investment, or other advice. Seek independent professional consultation in the form of legal, financial, and fiscal advice before making any investment decision. Always perform your own due diligence.