
Chart of the Day: March 10, 2023
Risk returns to asset markets.

 | Seeking Alpha")
Today’s Chart(s) of the Day has a number of charts but is not going to go into a great deal of detail on any one of them — it was a big week and its a Friday so hopefully the visuals will help put things in perspective.
In Tuesday March 7th’s Chart(s) of the Day, I provided a substantial amount of evidence for an oncoming recession. Also, yesterday morning I posted on LinkedIn what I saw as the major risk that markets are not pricing in correctly, here’s what I said:
Figure 2 and Figure 3 are the charts of M2/M2 growth and Real M2/Real M2 growth I referenced in my LinkedIn post.
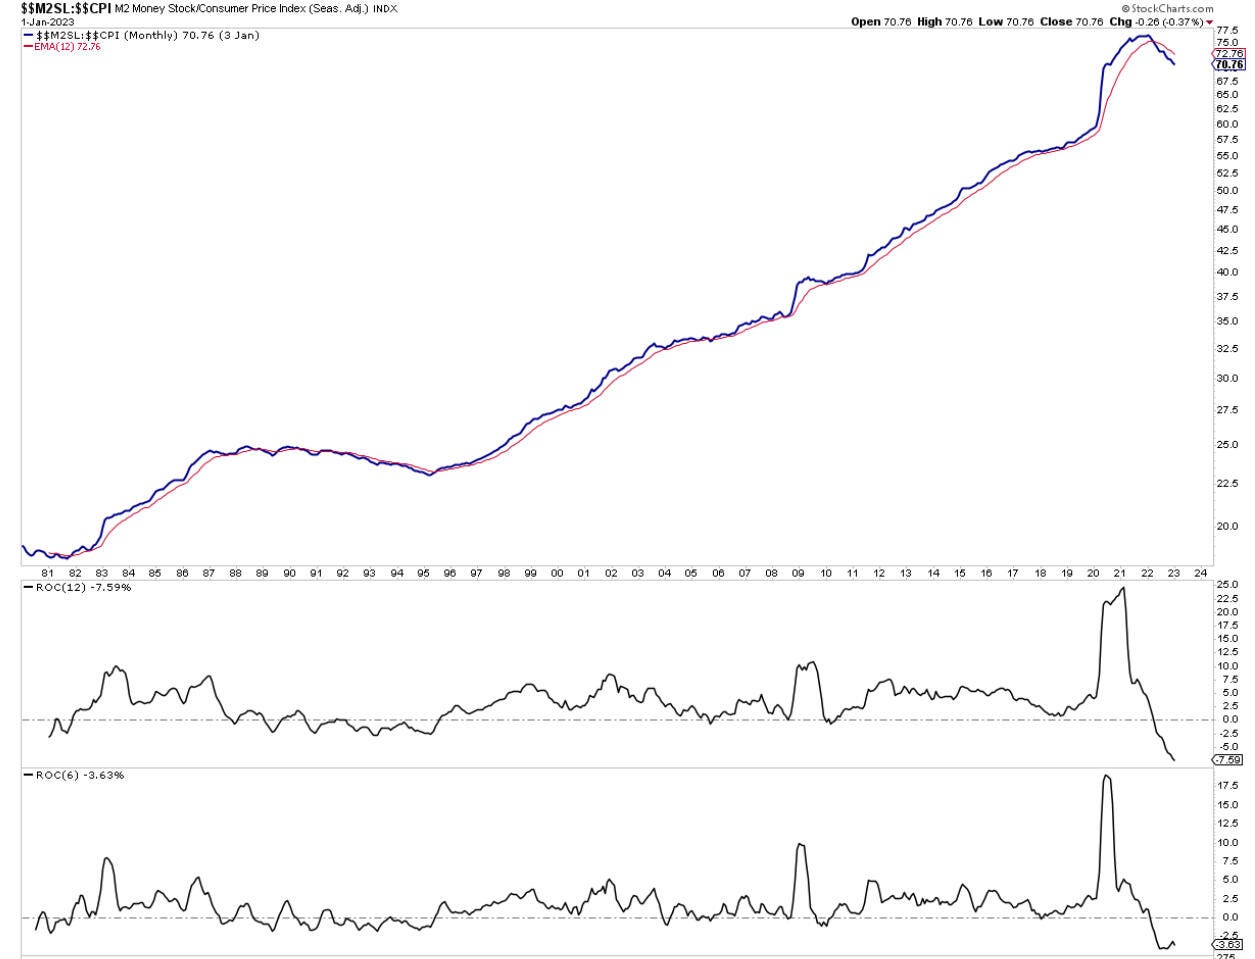
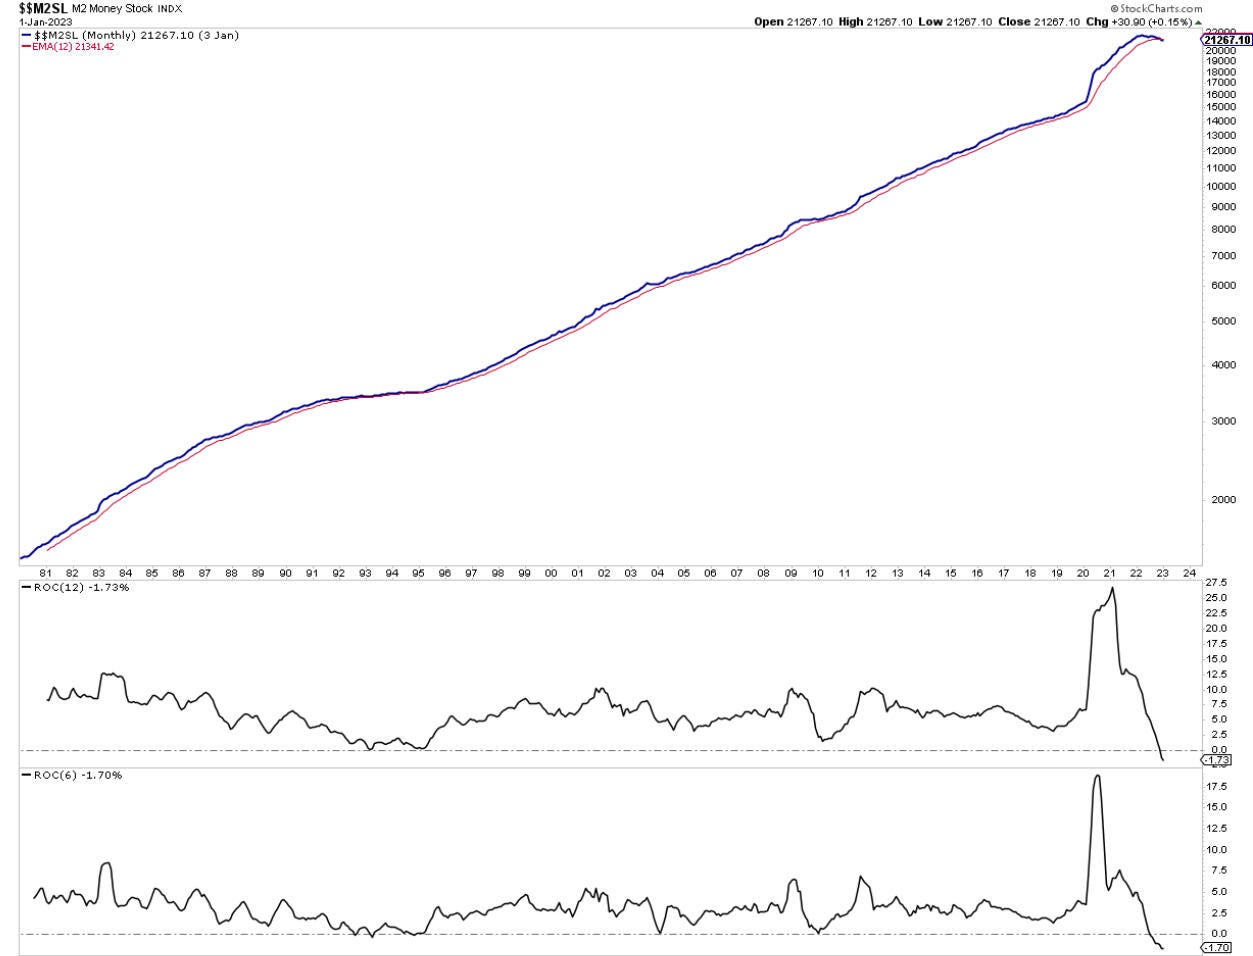
Historically, when M2 money supply contracts as much and as fast as it is right now, it is highly deflationary. Less spendable money inevitably leads to less spending. Less spending chasing the same amount of goods and services = competition = falling prices = lower revenues / earnings = higher unemployment = even less spending……
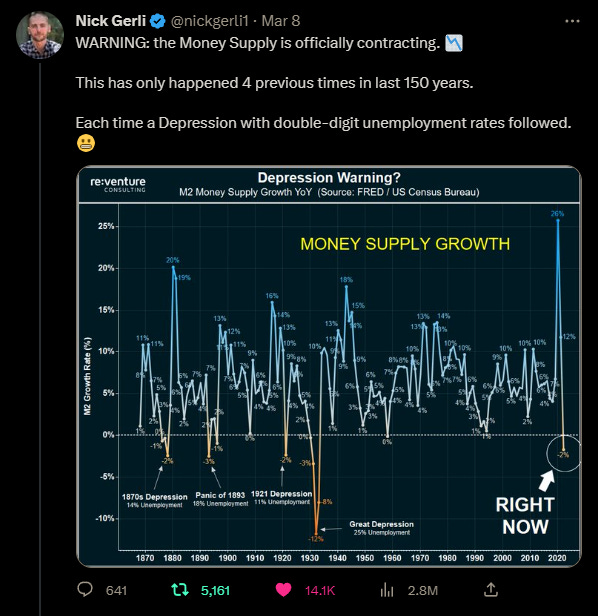
In Figure 4, financial analyst Nick Gerli provides some additional commentary on periods with declining M2.
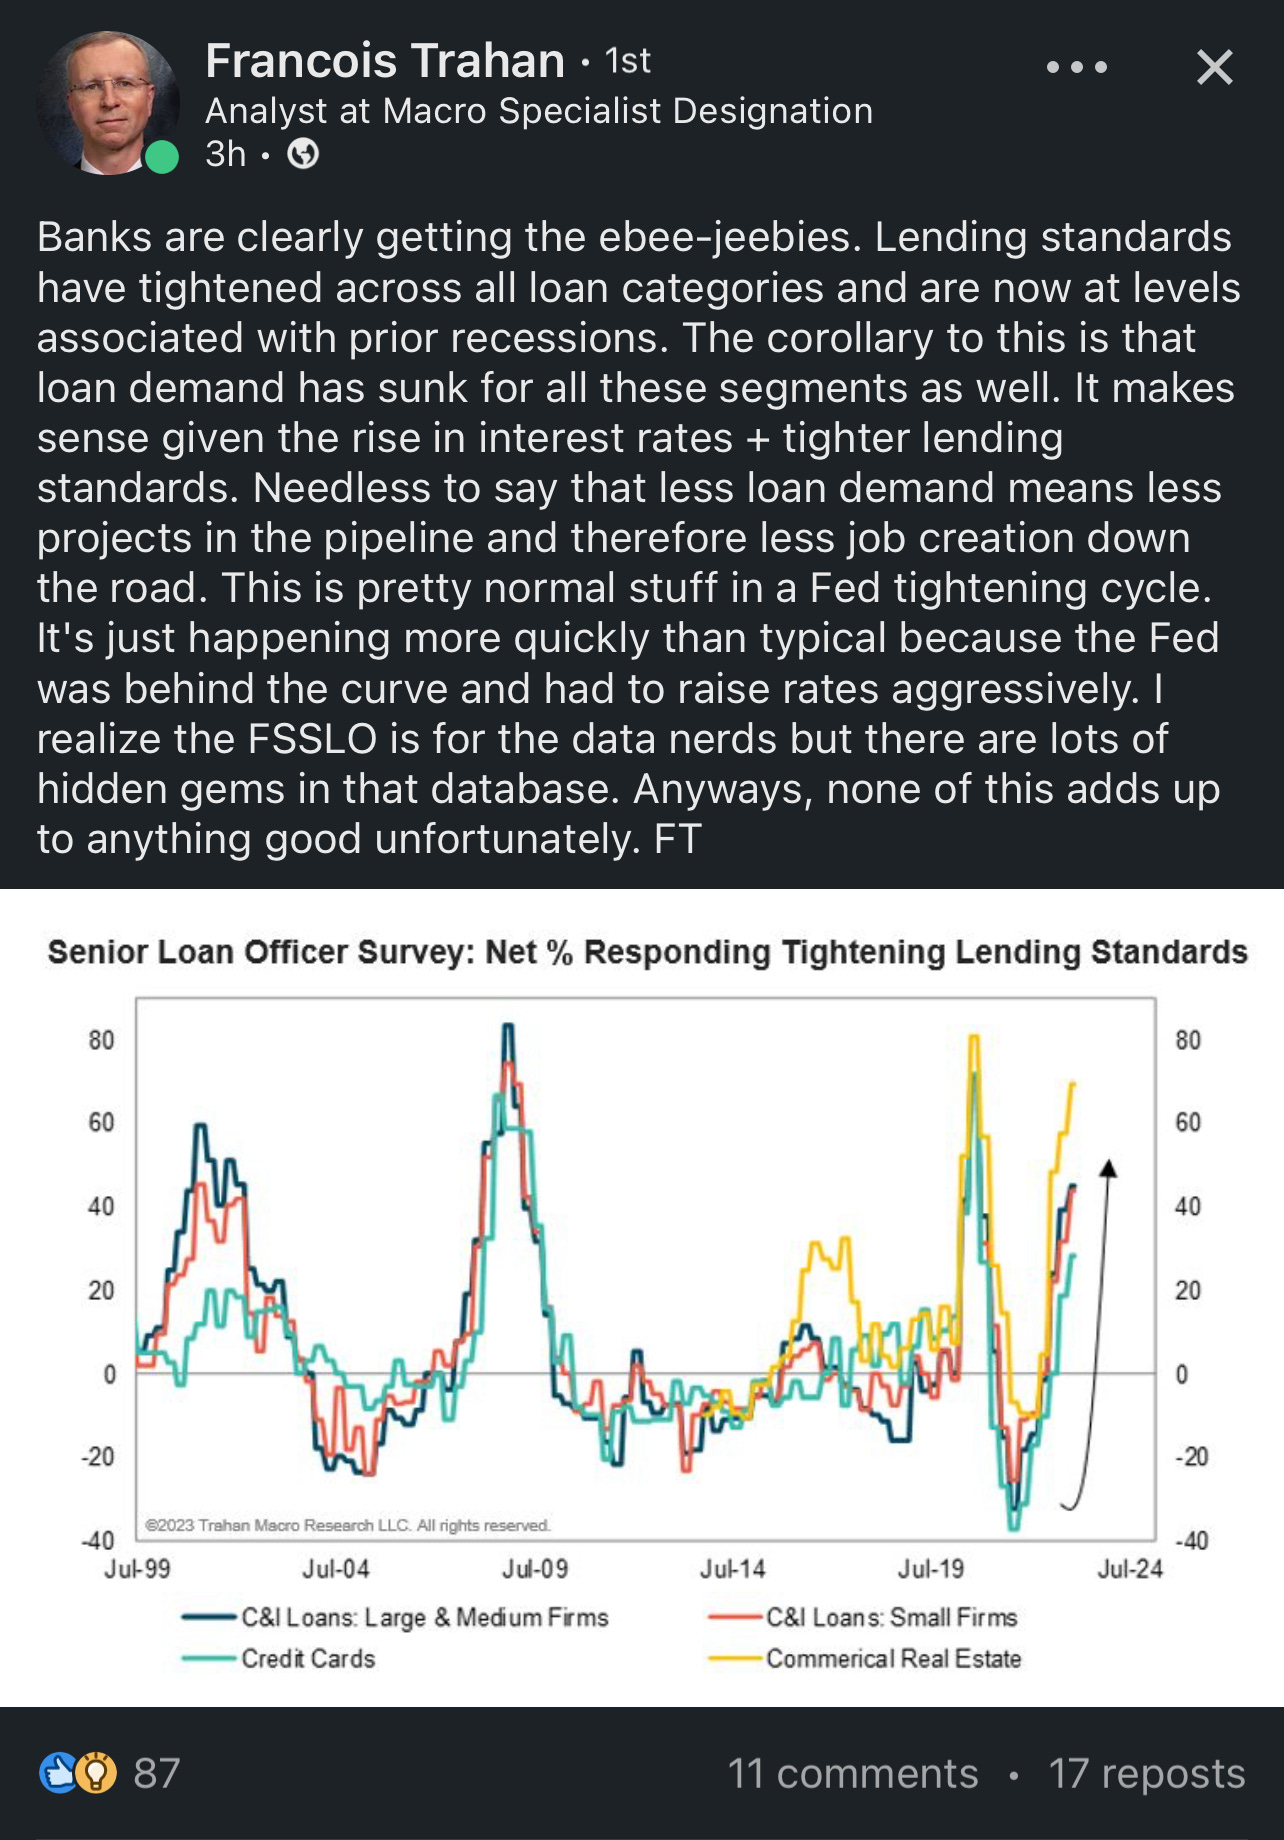
Why is the M2 money supply falling? Global central banks are purposefully reducing global liquidity in an effort to combat inflation (FYI, they always tighten for too long). Also, the banking system has been rapidly tightening lending standards, reducing the supply of loans — at the same time as central banks have raised interest rates at a historic pace, reducing customer’s demand for loans. Less lending = less money supply = less spending. Central banks are getting what they wanted. Figure 5 shows the total assets of the big 4 central banks (a simple proxy for liquidity). Figure 6 shows the rapid tightening of bank lending standards, along with some spot on commentary from macro analyst Francois Trahan.

In Figure 5 it appears as though central banks are continuing to withdrawal liquidity from the global financial system. Total assets has resumed its downtrend and is now falling below a declining moving average — an indication of a confirmed downtrend.
In the last couple of days, markets seem to be awakening to the risk of recession, which brings with it deflationary conditions. When markets are primarily worried about inflation, stocks and bond yields are negatively correlated. In other words, when bond yields decline, stocks and other risk assets will usually catch a bid. This week, this correlation broke. Bond yields and stocks are now positively correlated. Figure 7 shows this shift.

In Figure 7, the top panel shows the 2 year treasury yield and the bottom panel the S&P 500 Index. Notice that when the 2 year yield topped in October, the stock market began rising. When the 2 year yield bottomed on February 3, the stock market began falling again. However, in the last two days, both bond yields and the stock market have been collapsing in unison — a major shift in correlation. Markets are now concerned with the risk presented by recession and serious dis-inflation or even outright deflation.
Figure 8 shows the impact this shift has on risk assets, in particular the stock market.
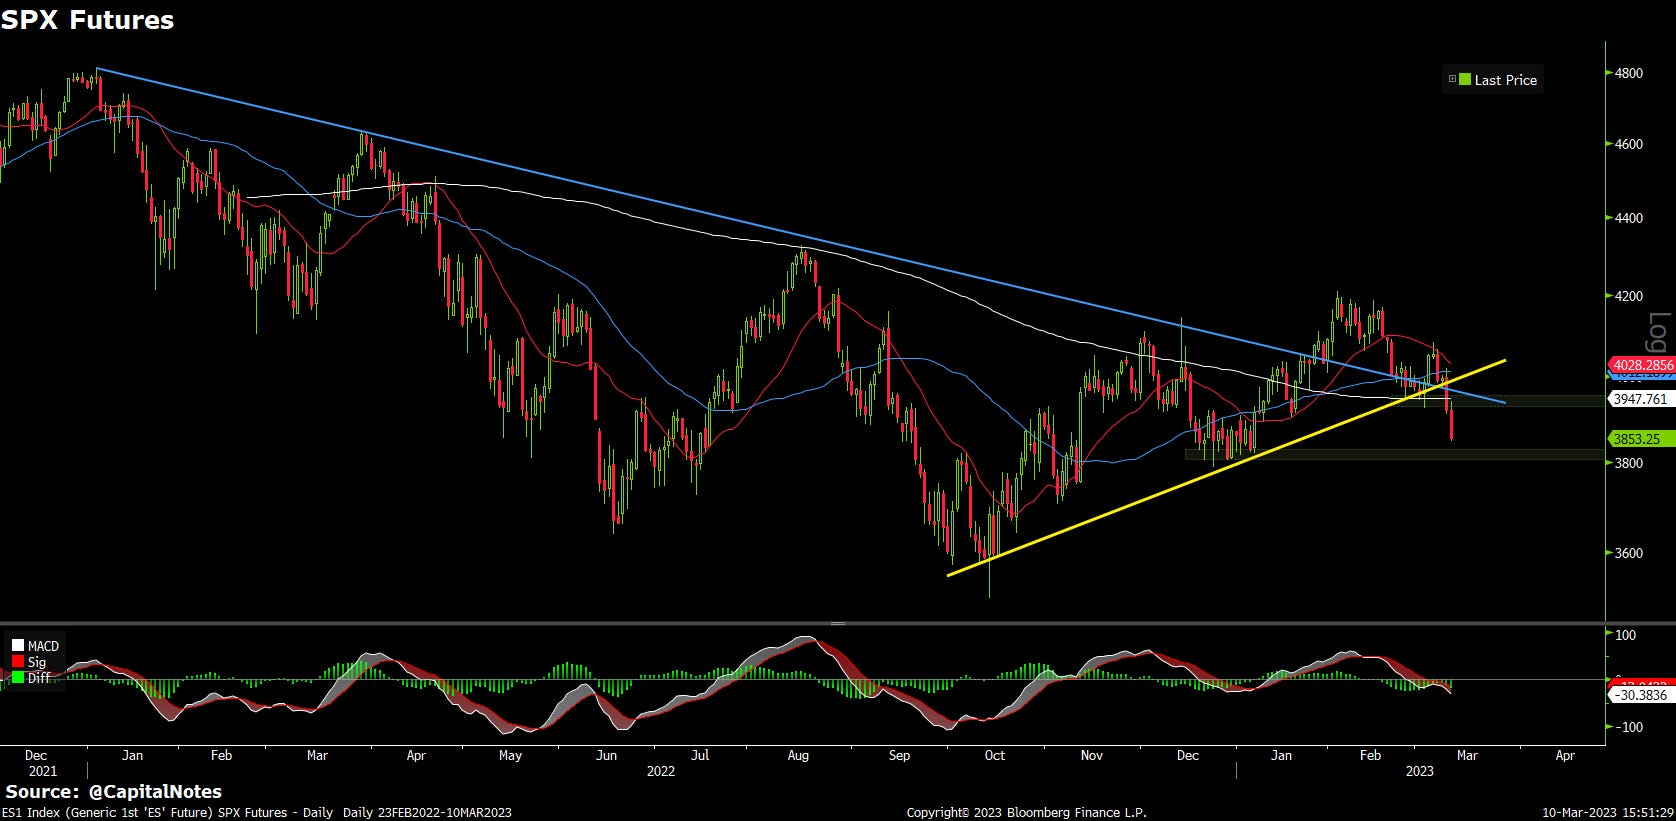
Figure 8 shows the stock market has resumed its downtrend and its beginning to look like the bear is back. Stocks broke back below the bear market trendline, the 200 day moving average, and the uptrend established since the October lows. These are all major technical indicators of a move back into a major downtrend. Next support is in the 3800 area, if it fails to hold markets will likely retest the October bear market lows in the 3575 range. That is approximately 8% below current levels.
The move in stocks was confirmed by a major reversal in my aggregate risk on vs risk off index — see in Figure 9.

My custom, Aggregate Risk On vs Risk Off Index failed to make a new high on March 6th and quickly reversed, undercutting its February 22nd lows today. This indicates a lower high and a lower low, a new downtrend. There is also a KST sell signal in the 2nd panel of Figure 9. This is bearish for risk assets and confirms the rest of this analysis. First support for this index is at the 200 day moving average, which is a significant drop from current levels, indicating potential room for more downside in risk assets before a bottom is found.
The weather has been warm and it seems the bears have been awakened early from hibernation.
— Brant
Disclaimer: The content provided on the Capital Notes newsletter is for general information purposes only. No information, materials, services, and other content provided in this post constitute solicitation, recommendation, endorsement or any financial, investment, or other advice. Seek independent professional consultation in the form of legal, financial, and fiscal advice before making any investment decision. Always perform your own due diligence.