


Quick note: if you haven’t yet, be sure to check out yesterday’s Chart of the Day. In it we provide substantial evidence for storm clouds on the horizon. It’s times like these when the analysis described in today's note is important. Be mindful of the price you pay.
In today’s Chart of the Day we take a quick look at another one of the Capital Notes custom indicators. This one comes in the form of a relative valuation dashboard.
Figure 1 shows each of the 11 S&P 500 sectors presented as a relative valuation vs the S&P 500 Index. Each chart is plotted as a Z-Score. If the blue line is at 0, that sector is trading at its average historical valuation vs the S&P 500. The red and green lines represent 2 standard deviations + / - away from the average. Therefore, if one of the blue lines moves above or below one of the red or green horizontals, that sector may be historically over- or undervalued vs the S&P 500.
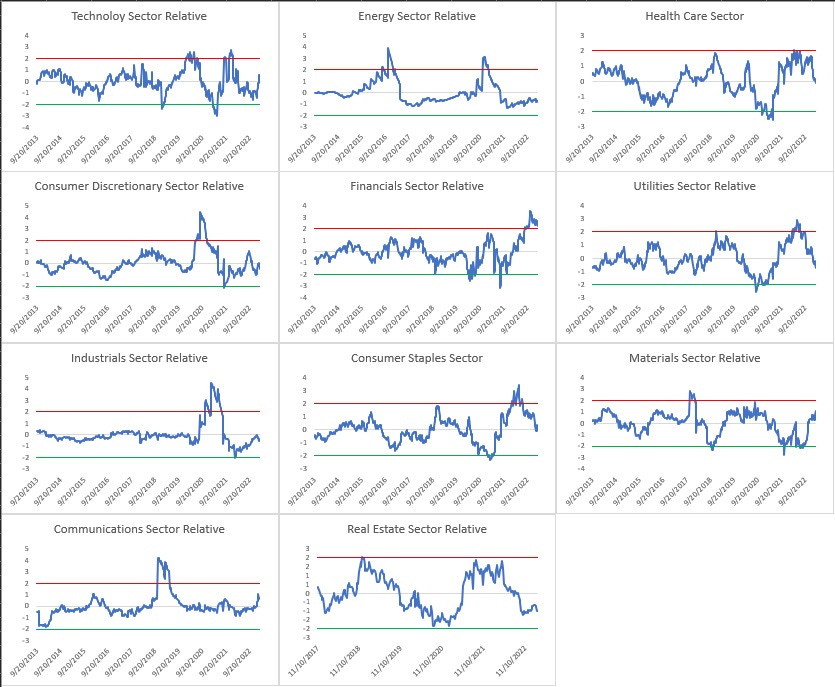
At the moment, there are no clear standout undervalued sectors. Although industrials, real estate, energy, and utilities are currently below their historical average valuations when compared to the S&P 500. Should the market decline in the short / intermediate term, those sectors represent a great starting point when looking for bargain assets.
Only one sector can clearly be identified as overvalued compared to the market, financials. As of the market close on 3/8/2023, financials were stretched over 2 standard deviations above their historical average valuation vs the S&P 500. I’m inclined to underweight financials in my portfolio until their relative valuation vs the rest of the market improves.
Remember, forward returns are directly related to the price you pay. Rotating Capital out of expensive sectors and into those that are undervalued is a time tested strategy for effective asset allocation.
— Brant
Disclaimer: The content provided on the Capital Notes newsletter is for general information purposes only. No information, materials, services, and other content provided in this post constitute solicitation, recommendation, endorsement or any financial, investment, or other advice. Seek independent professional consultation in the form of legal, financial, and fiscal advice before making any investment decision. Always perform your own due diligence.
historical - what time period is deemed "history"- over how long period of time are the averages calculated?