Just a couple of days ago, July 31st, one of Wall Street’s most ardent bears finally capitulated to the bull camp. See Figure 1 below.
To be expected from those that study to understand market history and the nature of human psychology — Mike Wilson’s capitulation comes after a long period of low and declining volatility typical of the first half of the calendar year. This type of price action can lull even the most stubborn of investors into a false sense of security. Once the pain of being wrong becomes too extreme they can succumb to FOMO (peer pressure) and they inevitably join the herd. It’s at the point the most stubborn among us flip their preferred narrative that markets tend to shift in the opposite direction.
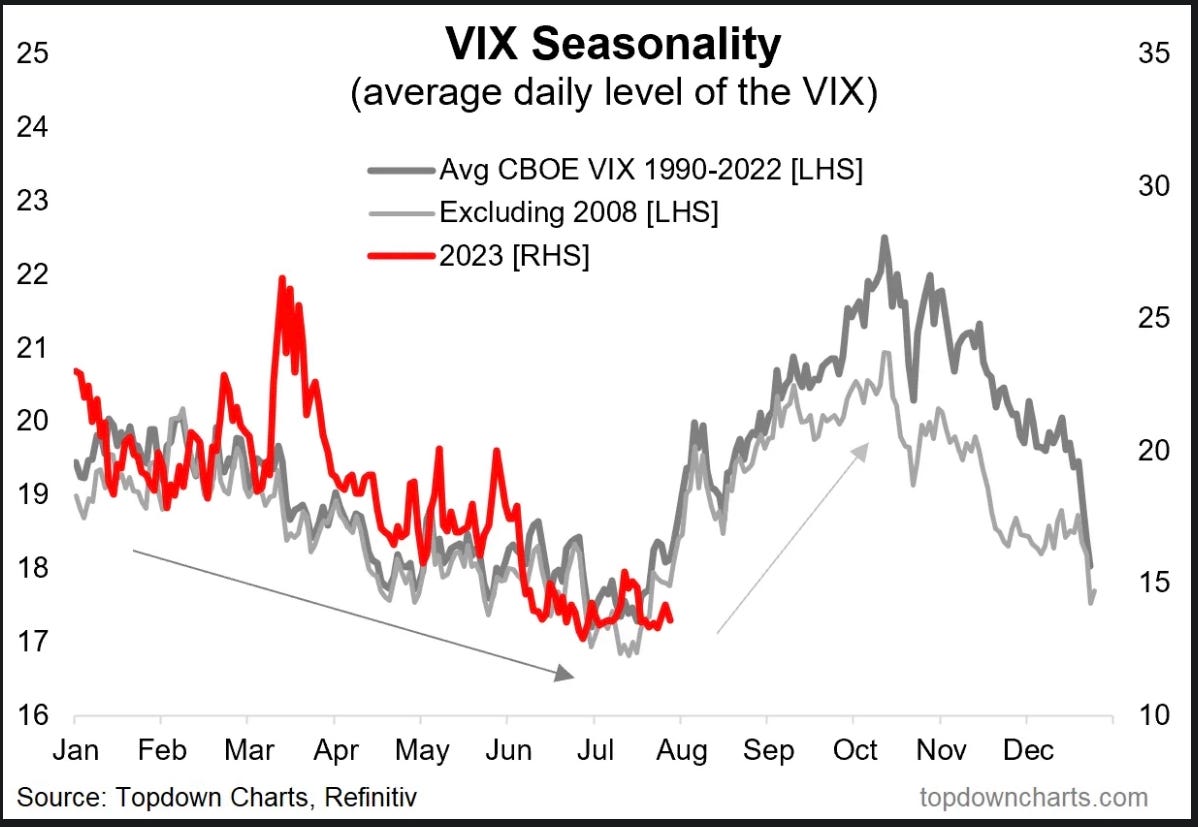
As seen in Figure 2 below, a typical year witnesses a period of low volatility in Q1 and Q2 only to be followed by a shift to a high volatility environment during Q3 (July through October). So far, 2023 has been a very typical year for volatility (red line).
From Topdown Charts a description of Figure 2:
'Tis the Season to be Volly: Indeed, the seasonal tendency is for higher volatility around this time of the year; climaxing around October. With sentiment increasingly frothy, valuations back to expensive levels, and still murky macro, the path higher may not be as smooth or simple as it seems.
Almost as if scripted, volatility resurfaced during the first 2 days of August, especially today. The S&P 500 opened today in the red, down over 0.6% and traded lower the entire day, closing approximately -1.4%. The media explains the move lower using the news of Fitch downgrading the US government’s credit rating from AAA to AA+, but the truth is everyone already knew what information Fitch had to offer. The overcrowded bull side on the boat just needed any reason to jump ship and this downgrade happened to be it.
By the way, and I’ll be quick about it, I’ve seen many in the mainstream media and on Twitter (X) acting surprised about the downgrade. Really? Check out Figure 4 and Figure 5, both from Joe Consorti at
(a Substack that is well worth the price of admission):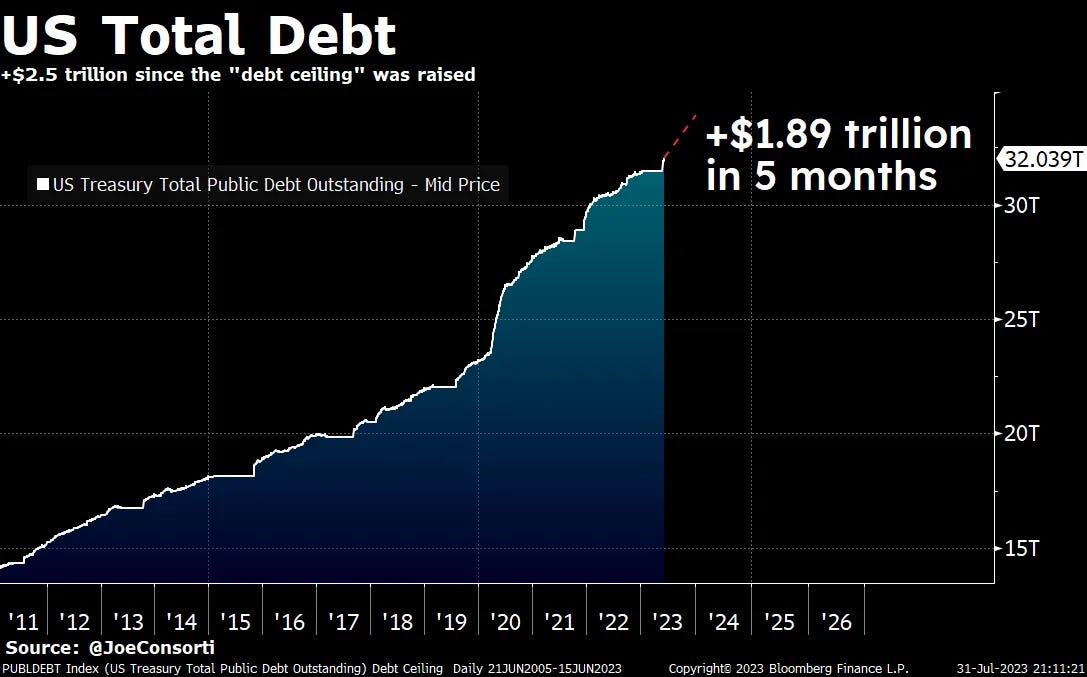

I’ll let them sum it up:
“The more disconcerting long-term issue is that of the federal deficit. We have consumed far more than we have produced for too long at the government level, recently hitting a $1.39 trillion funding deficit for the first time ever. Austerity or an extreme increase in productivity is needed to get the government’s funding situation back on track. Ideally, this happens soon before we go off the rails.”
—
In other words, it should come as no surprise to anyone that Fitch decided to follow in S&P’s footsteps and downgrade the USA’s credit. Check out their full post here for a more detailed analysis.
This is not a prediction — just an analysis of potential support levels should the bears choose this point to decide to wake from their slumber. Figure 6 shows a daily chart of S&P 500 futures. The primary US index has been in a strong uptrend since April. The primary support levels to watch at this juncture are the orange uptrend line and minor support at 4411 and 4369. Should these levels break, expect at least a retest of the early-June breakout at 4209.
Given the longer term sentiment, valuation, and other fundamental reasons spelled out in my prior two posts, linked to below, there is major fuel for the bears to run markets toward that 4209 level. A correction will come and it’s likely to happen quickly when it does. It’s easy to recognize that. The hard part is knowing how far the bulls can stretch prices to the upside before gravity exerts its influence.
Check out these post for more detail on current market conditions:
July 20, 2023: Feelings of Deja Vu: Shades of 2007 as lag effect amnesia grabs hold.
July 30, 2023: Optimism is High: Expectations are nearing extremes.
Not to leave you hanging — let me provide you with a couple more charts that show a bit of the “long-term” situation US investors find themselves in.
Figure 7 shows the relationship between bank lending standards and the unemployment rate. Historically, lending standards tend to lead the unemployment rate by approximately 18 months. When banks tighten credit standards, it takes quite awhile to that to translate into less borrowing and less spending which translates into less sales for businesses and ultimately layoffs as companies look to cut costs and maintain positive margins. TL:DR: Figure 7 suggest a rise in unemployment is still on the way, despite the “soft landing” / recession canceled narrative.
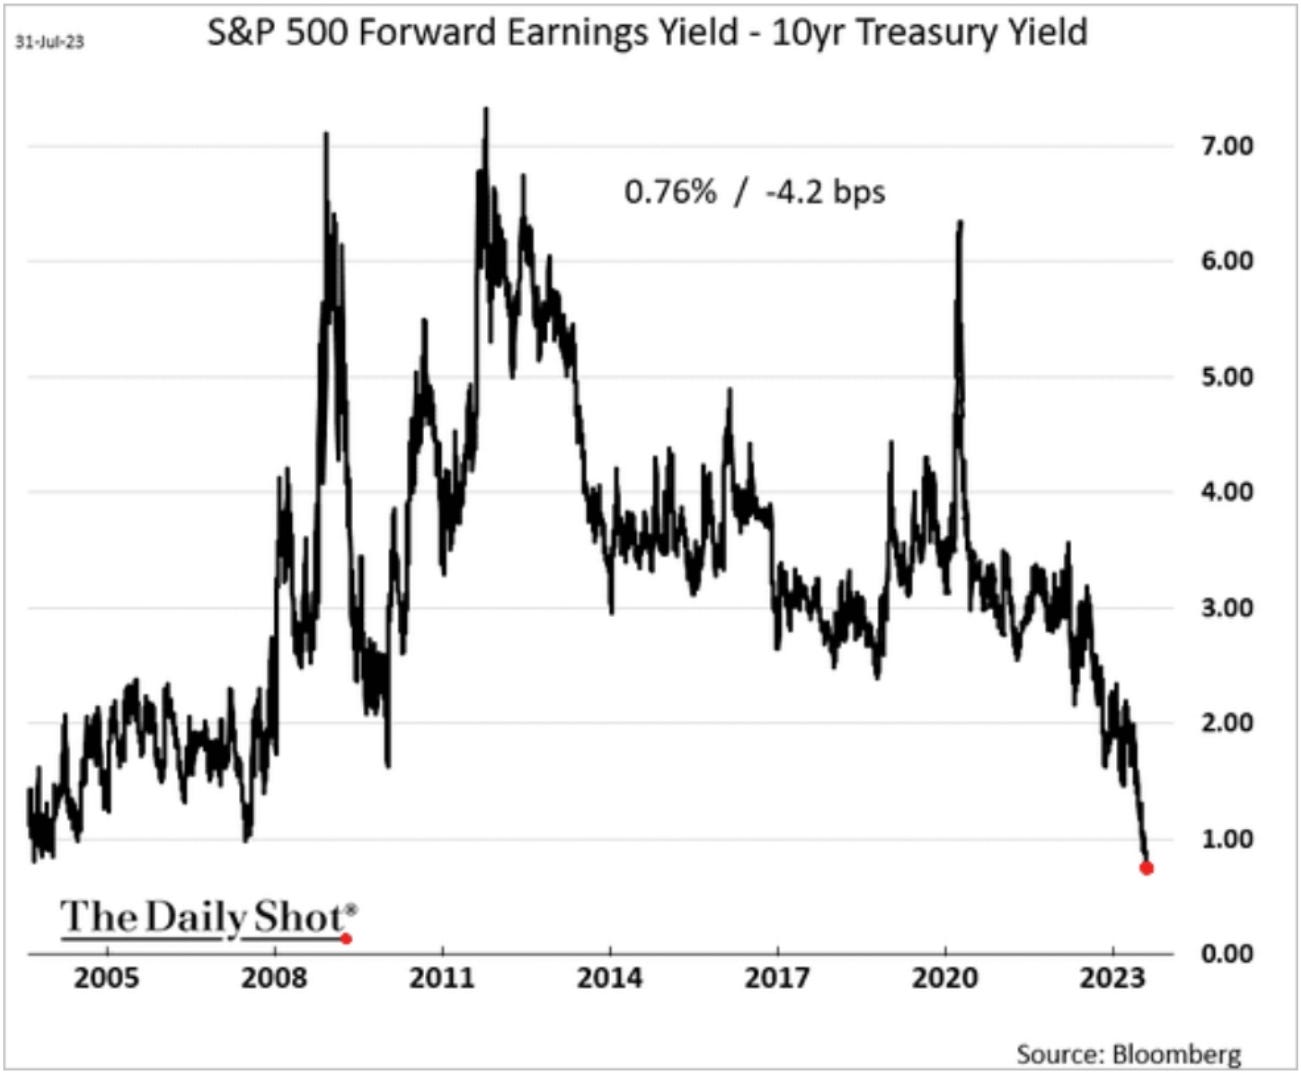
The next two charts show in separate ways how equity investors buying the broad indexes at current levels are, relative to historical norms, not being compensated for the risk they are taking. In Figure 8 we can see that the S&P 500 equity risk premium continues to collapse. From Investopedia:
The term equity risk premium refers to an excess return that investing in the stock market provides over a risk-free rate. This excess return compensates investors for taking on the relatively higher risk of equity investing.
Long-term investors want to be backing up the truck on equities when the equity risk premium is near historic highs (above 5% in Figure 8) and both cautious and selective when the premium is well-below average, as it is today.
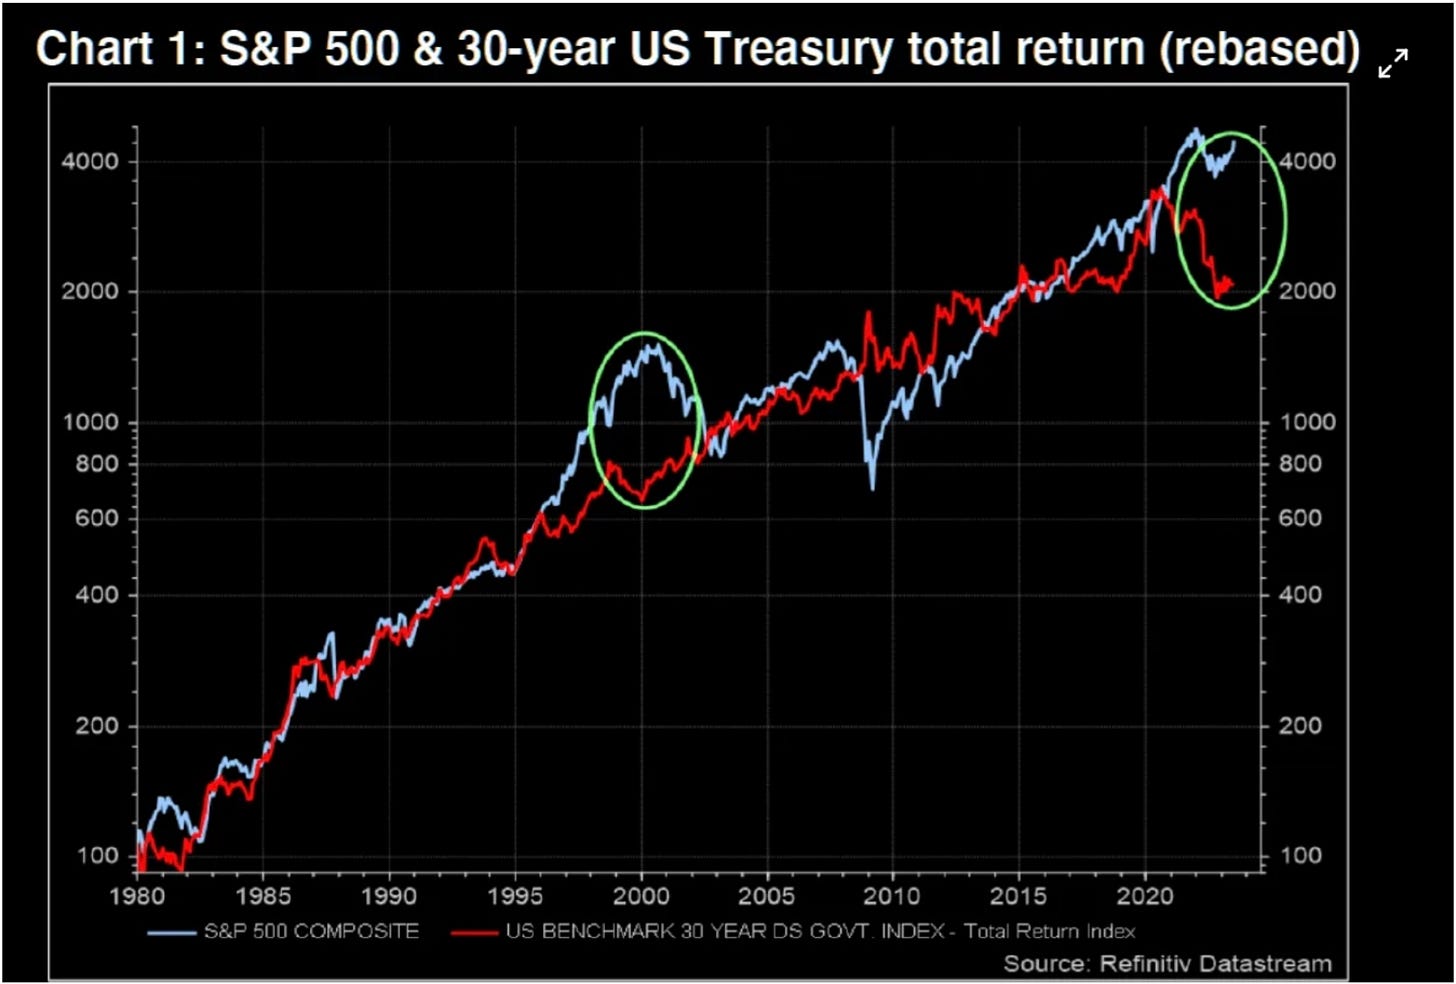
I’ll allow TME to quickly explain Figure 9.
"Markets are offering the best incentive pricing for half a century to rebalance portfolios away from equities and back into bonds, equaling only the extreme divergence seen in January 2000."
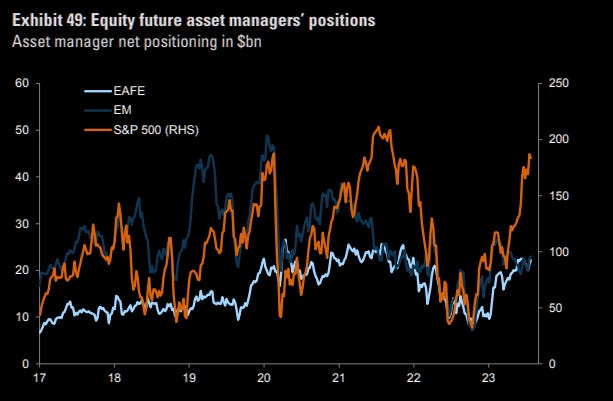
Finally, one more chart reinforcing the message I’ve been shouting from the rooftops lately — sentiment is extremely bullish and the US equity market is currently over-owned and over-loved. Figure 10 comes to us again from TME:
“From US with love: Asset managers have expanded the SPX long big time lately.”
I’ll borrow the conclusion from my post on July 20th to properly sum up the message from this section.
It's times like this that investors must remember that the future investment returns generated from an asset are DIRECTLY related to the price one pays for said asset. When there are clouds on the horizon it becomes more important to be selective when deploying additional capital, paying special attention not to overpay for your right to an asset's future earnings.
PSA: Capital Notes is switching gears.
Back on March 15, 2023 I asked my readers to complete a poll. The question was this:
Would you be interested in Capital Notes including a model portfolio as part of the services it offers readers? This would allow everyone to see how we invest our money.
Here were the results:
It was clear that readers want to see how I actually put the analysis I do into action.
Since March, I’ve been considering the best way to implement this into the newsletter. I’ll have more details soon, but in the future Capital Notes will be switching gears to focus almost exclusively on sharing with readers the day to day management of a portfolio. The analysis I periodically share now will still be included, but there will be much more, such as individual company analysis, valuation work, financial model constriction, how to think about, choose, and implement an asset allocation.
I believe I’ve thought of a unique way to share the management of a portfolio with my readers — the good, the bad, and the ugly. This is a style that I’ve not seen offered by other newsletters in the finance and investing genre and my hope is it will be how I can offer a unique value proposition to all current and future subscribers. I’m excited to begin this journey soon, please stay tuned.
— Brant
Disclaimer: The content provided on the Capital Notes newsletter is for general information purposes only. No information, materials, services, and other content provided in this post constitute solicitation, recommendation, endorsement or any financial, investment, or other advice. Seek independent professional consultation in the form of legal, financial, and fiscal advice before making any investment decision. Always perform your own due diligence.




That was very good, ty
Nice article Brant.