Is Santa Exhausted? The Probability is Growing
Studying investor psychology is important for long- and short-term investors.
Why investor psychology is important:
Will the Santa rally continue into January?
I actually meant to write this piece over the long New Year’s weekend but was not able to get around to it. Today will have to do and so far the market action in the pre-market (as I’m typing this) is starting to confirm my suspicion — the real Santa Claus has likely returned to the North Pole, leaving us with exhausted, unemployed imposters.
What am I talking about with this analogy?
I predicted a strong Santa rally in this post from December 1, 2023:
If you’ve been checking your 401K statements, you are well aware that Santa arrived in full force. However, using various sources we can infer the rally has potentially run too far, too fast and needs a bit of a reset. Sentiment has run ahead of reality and has left us with overbought and overbullish conditions that typically result in increased volatility and lackluster returns.
Is this a bad thing? No. Volatility and market declines present opportunity. Down markets should be welcomed by the enterprising investor — or at least anyone that cares about the price they pay when purchasing an asset.
ALWAYS REMEMBER THIS
“It's times like this that investors must remember that the future investment returns generated from an asset are DIRECTLY related to the price one pays for said asset. When there are clouds on the horizon it becomes more important to be selective when deploying additional capital, paying special attention not to overpay for your right to an asset's future earnings.” 1
One of these “times”, in my humble opinion, is now. I’m not predicting a major recession or a massive bear market. However, I think this is one of those environments where investors must temper their return expectations for the short- and intermediate term.
I’m a long term investor, why do I care about the short term?
If you are a long term, dollar cost averaging index investor (what most people should be), your biggest friend is the process of long-term compounding. Anything that interrupts the process of long-term compounding is your worst enemy.
Knowing when to expect increases in volatility and potential declines in risk asset prices can be a superpower to the intelligent investor.
Short and intermediate term market volatility, especially market declines of >15%, is almost always driven by events that are not predictable. The combination of the uncertainty created by unpredictable events, losses showing up on account statements, and the perpetual pessimism and doom in the mainstream media often convinces long-term investors that “this time is different” and they make the critical error of selling into the chaos — thus interrupting the process of compounding and potentially even creating an additional tax burden.
Knowing when to expect increases in volatility and potential declines in risk asset prices can be a superpower to the intelligent investor. If you expect something to occur it is no longer surprising, and therefore easier to act rationally during the chaos, potentially purchasing more assets at discounted prices instead of panic selling.
Chart Pack — Why do I expect Santa is heading home?:
Many of the sentiment and investor positioning indicators I follow are once again becoming stretched. These indicators show us what investors are thinking and where they are putting their money. In other words, they give us a glimpse into both their heads and their accounts. When these indicators reach extremes, and only when at extremes, they can be used in a contrarian way. In other words, when the crowd is frothing at the mouth bullish or despondent with doomsday gloom, we want to think twice about joining them and consider why they might be wrong about their extreme opinions.
“Bull markets are born on pessimism, grow on skepticism, mature on optimism, and die on euphoria.”
— John Templeton
In the future, my chart packs will follow the format used today. I’m going to display several, separated charts, each with a sentence or two explanation and then quickly wrap it all up at the end.
Now on to the show.
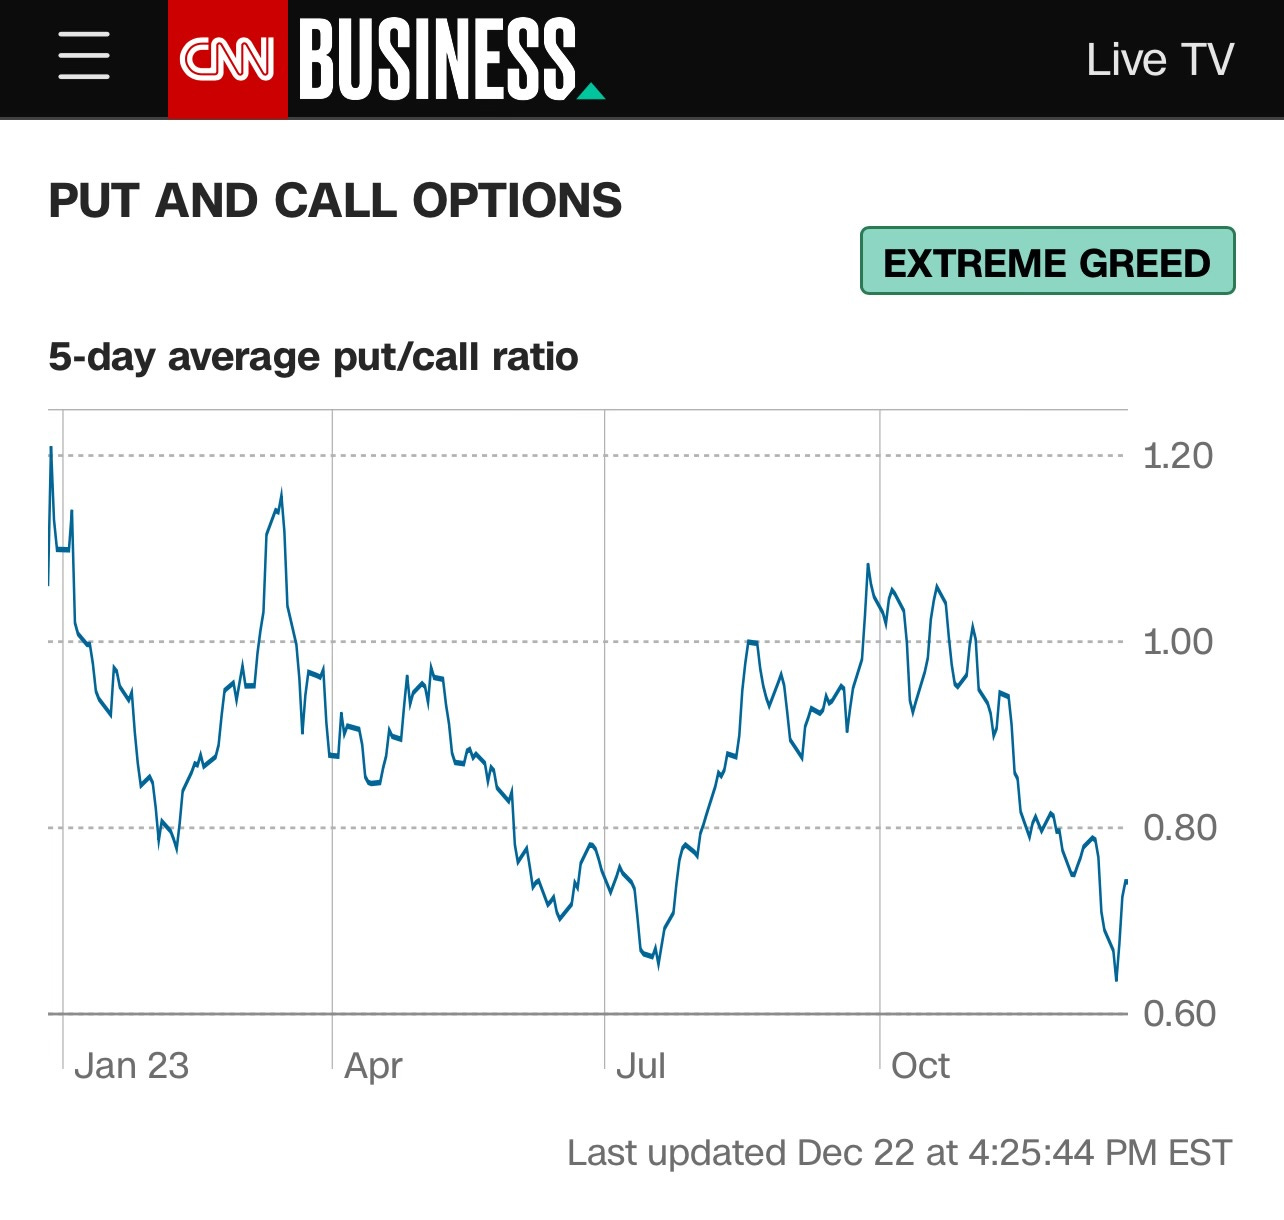
The Fear & Greed Index is back in Extreme Greed territory. Typically a level that indicates ann increased risk of short- to intermediate- term losses for new risk positions.
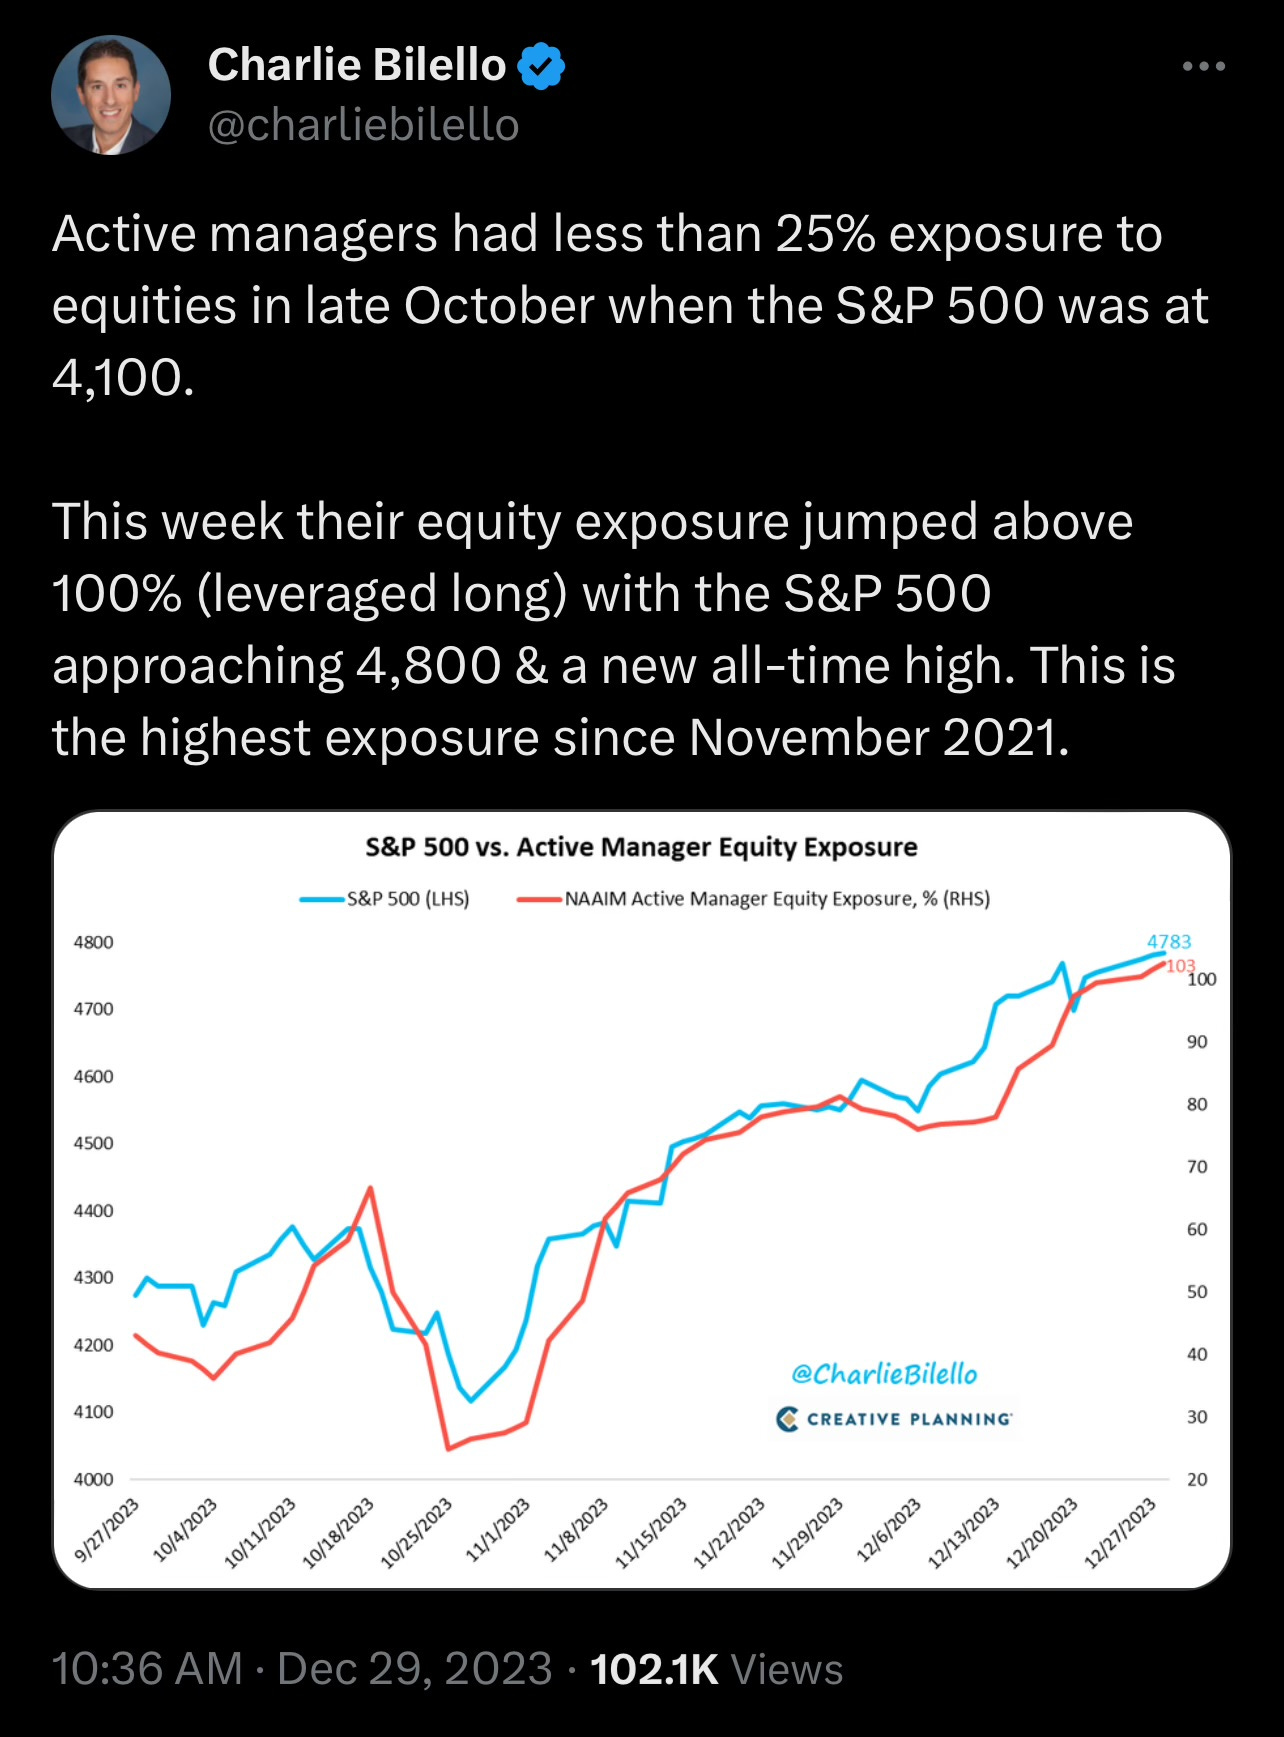
From late-October to late-December, fund managers have moved from a 25% exposure to equities to being leveraged long (greater than 100% exposure).
Retail investors have not been this bullish since April of 2021, according to the American Association of Individual Investors sentiment survey.
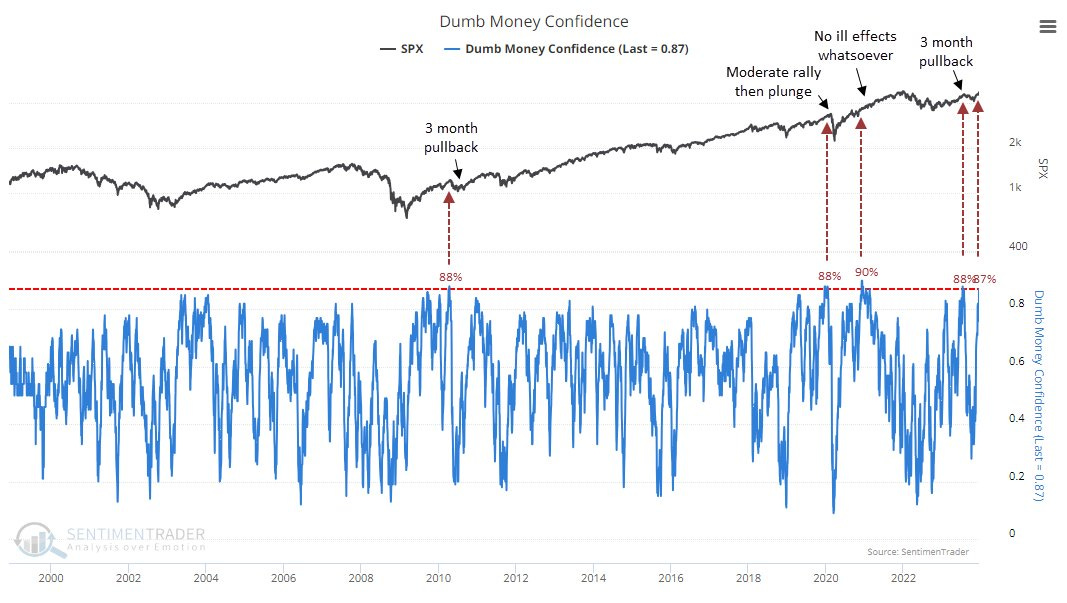
The Sentiment Trader Dumb Money Confidence Index recently reached the 3rd highest reading in 25 years.
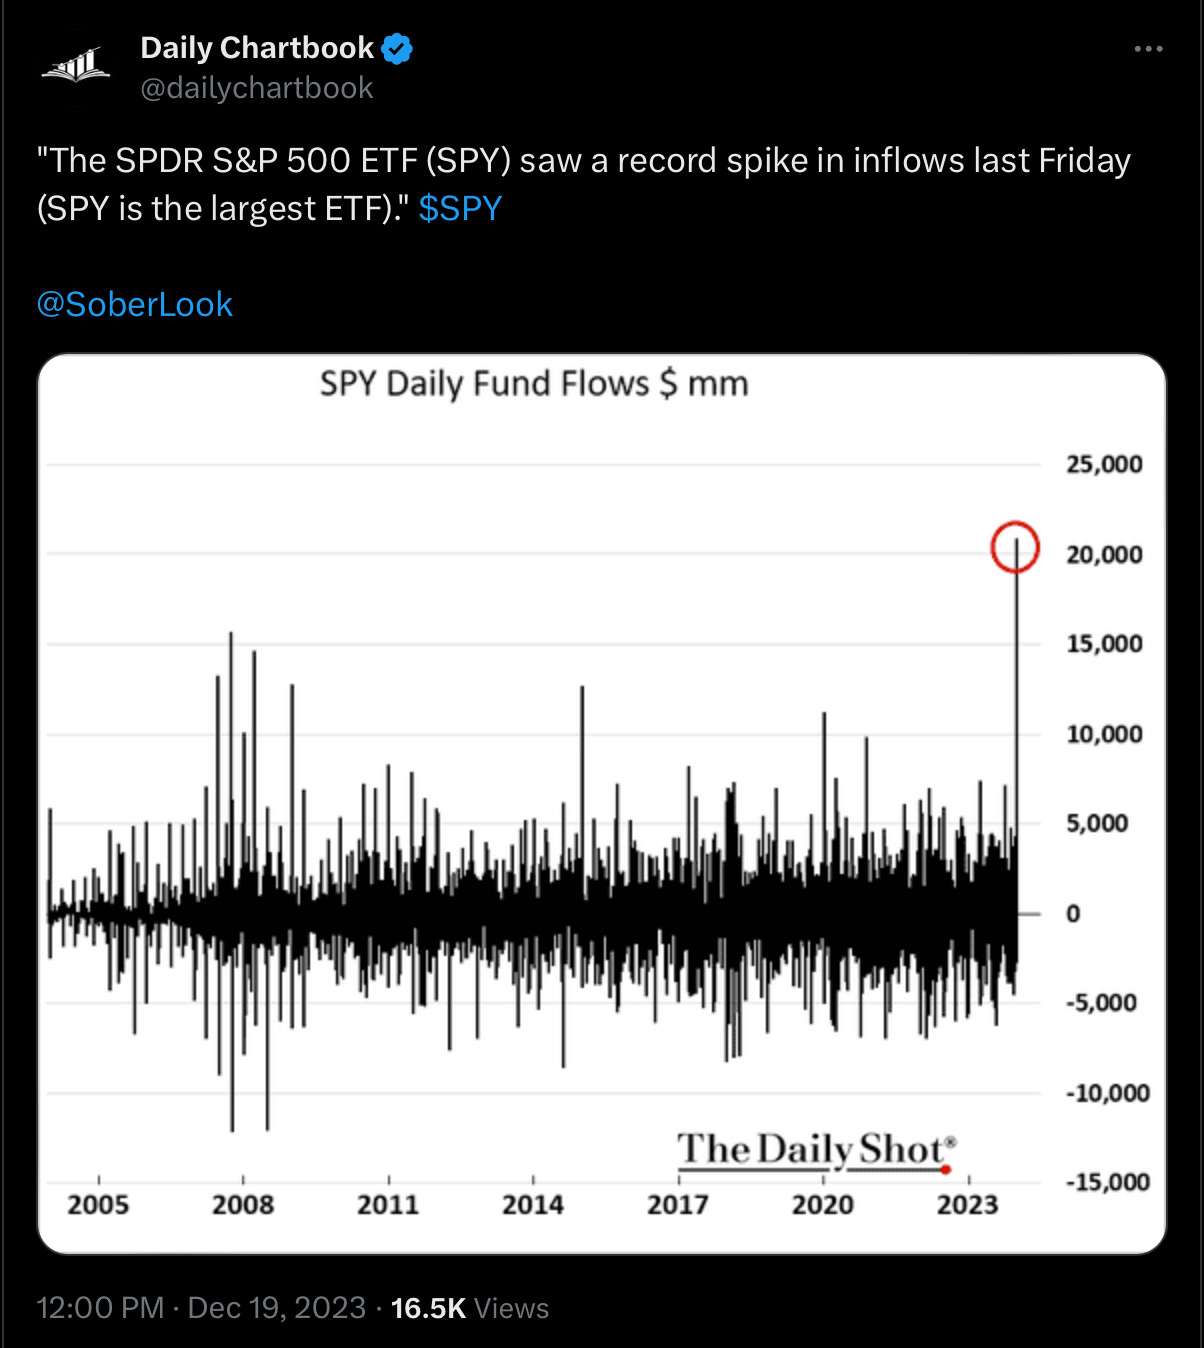
The most popular S&P 500 ETF, SPY, recently saw a record weekly inflow. This indicates extreme investor confidence.
Net long positioning in the Nasdaq 100 has reached extremes.
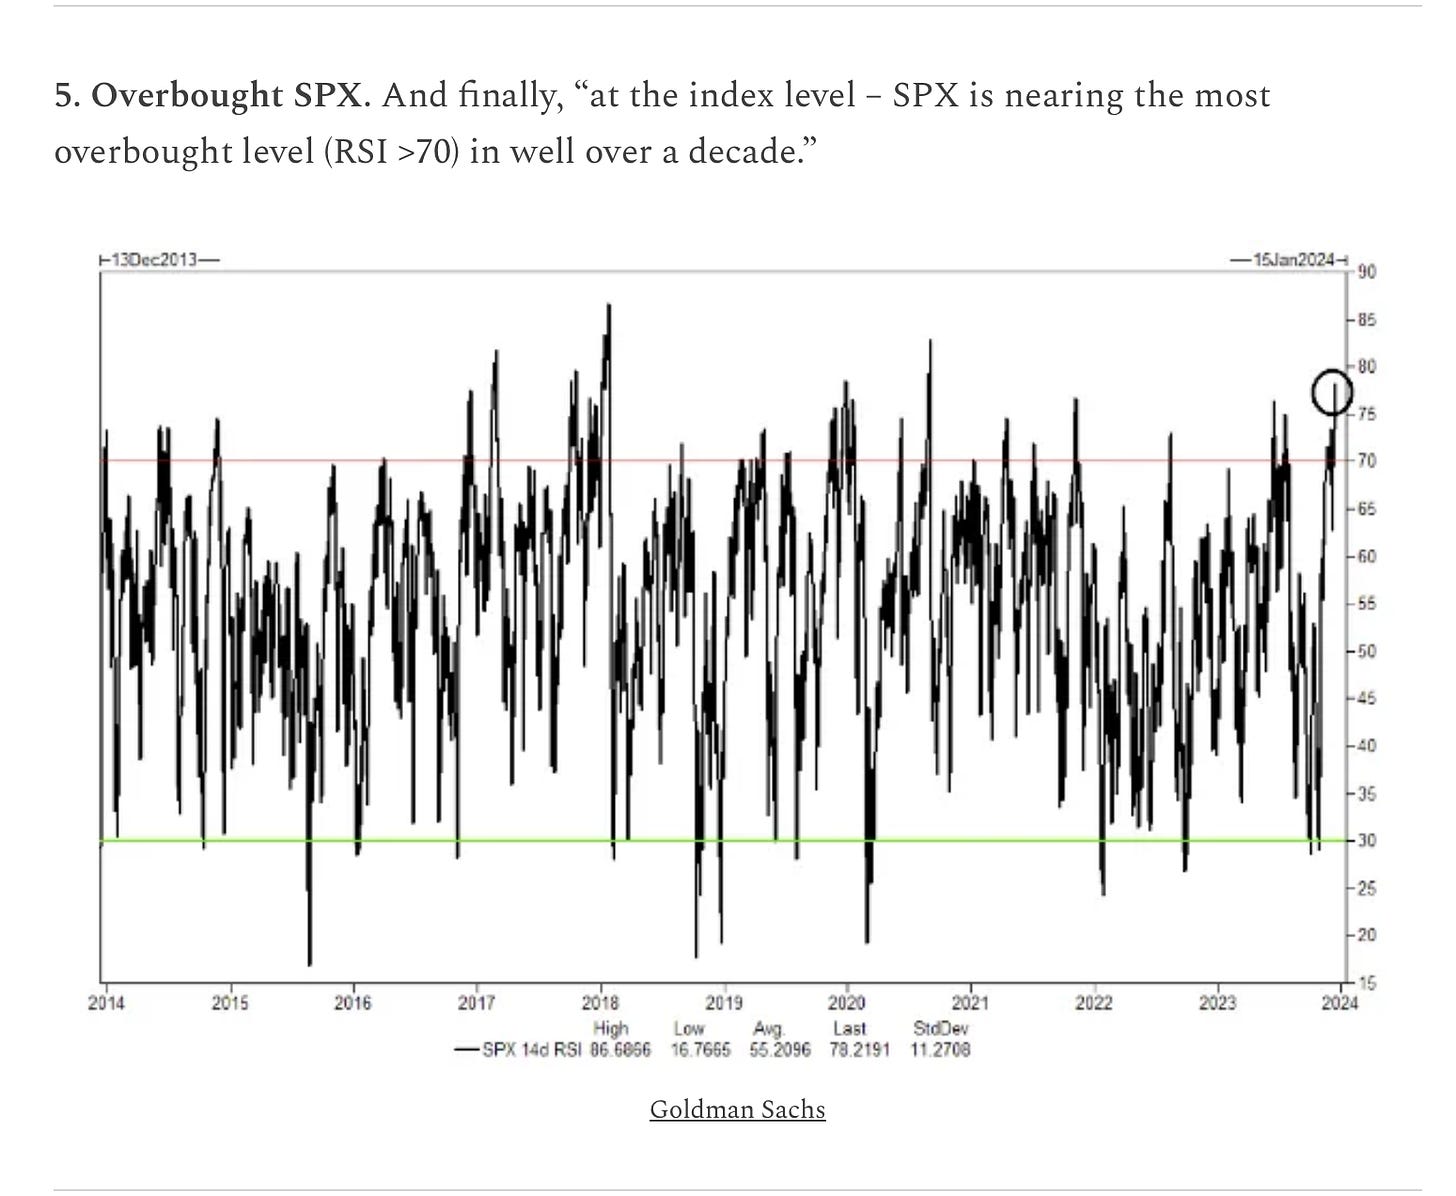
Equity indexes, such as the S&P 500, are technically at overbought levels.
CTA scenarios now skewed to the downside based on positioning. In other words, a move lower will lead to a larger $ amount of selling than a move higher will create in additional buying.
Bulls now outnumber bears by a significant margin, one historically associated with increased short- to intermediate-term downside risk.
The 5-day average of put and call options (put/call ratio) has reached levels that suggest options buyers are getting greedy.
Conclusion:
An analysis of the chart pack suggest that investor sentiment and positioning have reached levels that have historically led to a significantly higher chance of increased volatility and lower asset prices.
It is important for all investors to understand when these situations exist so they are not surprised by them. When they occur the informed investor can treat the volatility as an opportunity and act rationally to take advantage of it. For a long-term investor this can mean remaining loyal to your investment plan and not panic selling. While enterprising investors can use the chaos to accumulate additional shares of quality companies as they go “on sale”.
Let’s see what happens.
Please like, subscribe, and share if you enjoy this content. Your readership is much appreciated.
Happy New Year!
— Brant
Disclaimer: The content provided on the Capital Notes newsletter is for general information purposes only. No information, materials, services, and other content provided in this post constitute solicitation, recommendation, endorsement or any financial, investment, or other advice. Seek independent professional consultation in the form of legal, financial, and fiscal advice before making any investment decision. Always perform your own due diligence.
Quote from the article I published on July 20, 2023, just before the late-summer / fall correction in risk asset prices. Read that piece here: https://capitalnotes.substack.com/p/feelings-of-deja-vu


