This post is not about markets. In it I am not, no matter the conclusion, attempting to determine the direction of the stock market. This is a post about the economy. For my latest thoughts on markets see these posts:
Feelings of Deja Vu: Shades of 2007 as lag effect amnesia grabs hold.
The Final Bear Capitulates?: Volatility returns, right on cue.
It’s been quite awhile since I’ve shared a full update of my economic cycle framework. As a refresher, I’ll start by stealing a portion from last summer’s economic cycle analysis.
What are the stages of the economic cycle?
Starting with a new cycle reset, the stages are as follows — I’ll turn to Fidelity for a definition of each cycle stage:
Ice / Recession: “Features a contraction in economic activity. Corporate profits decline and credit is scarce for all economic factors. Monetary policy becomes more accommodative and inventories gradually fall despite low sales levels, setting up for the next recovery.”
Goldilocks: “Generally, a sharp recovery from recession, marked by an inflection from negative to positive growth in economic activity (e.g., gross domestic product, industrial production), then an accelerating growth rate. Credit conditions stop tightening amid easy monetary policy, creating a healthy environment for rapid profit margin expansion and profit growth. Business inventories are low, while sales growth improves significantly.”
Fire / Boom: “Typically the longest phase of the business cycle, the mid-cycle is characterized by a positive but more moderate rate of growth than that experienced during the early-cycle phase. Economic activity gathers momentum, credit growth becomes strong, and profitability is healthy against an accommodative—though increasingly neutral—monetary policy backdrop. Inventories and sales grow, reaching equilibrium relative to each other.”
Stagflation: “This phase is emblematic of an "overheated" economy poised to slip into recession and hindered by above-trend rates of inflation. Economic growth rates slow to "stall speed" against a backdrop of restrictive monetary policy, tightening credit availability, and deteriorating corporate profit margins. Inventories tend to build unexpectedly as sales growth declines.”
Throughout history, each of these stages has common themes that can be identified in various forms of economic and financial market data. Over time, I have put together a number of these indicators and defined what the indicator looks like in each stage of the cycle. Using a weight of evidence approach, one can make an educated guess at the current cycle stage.
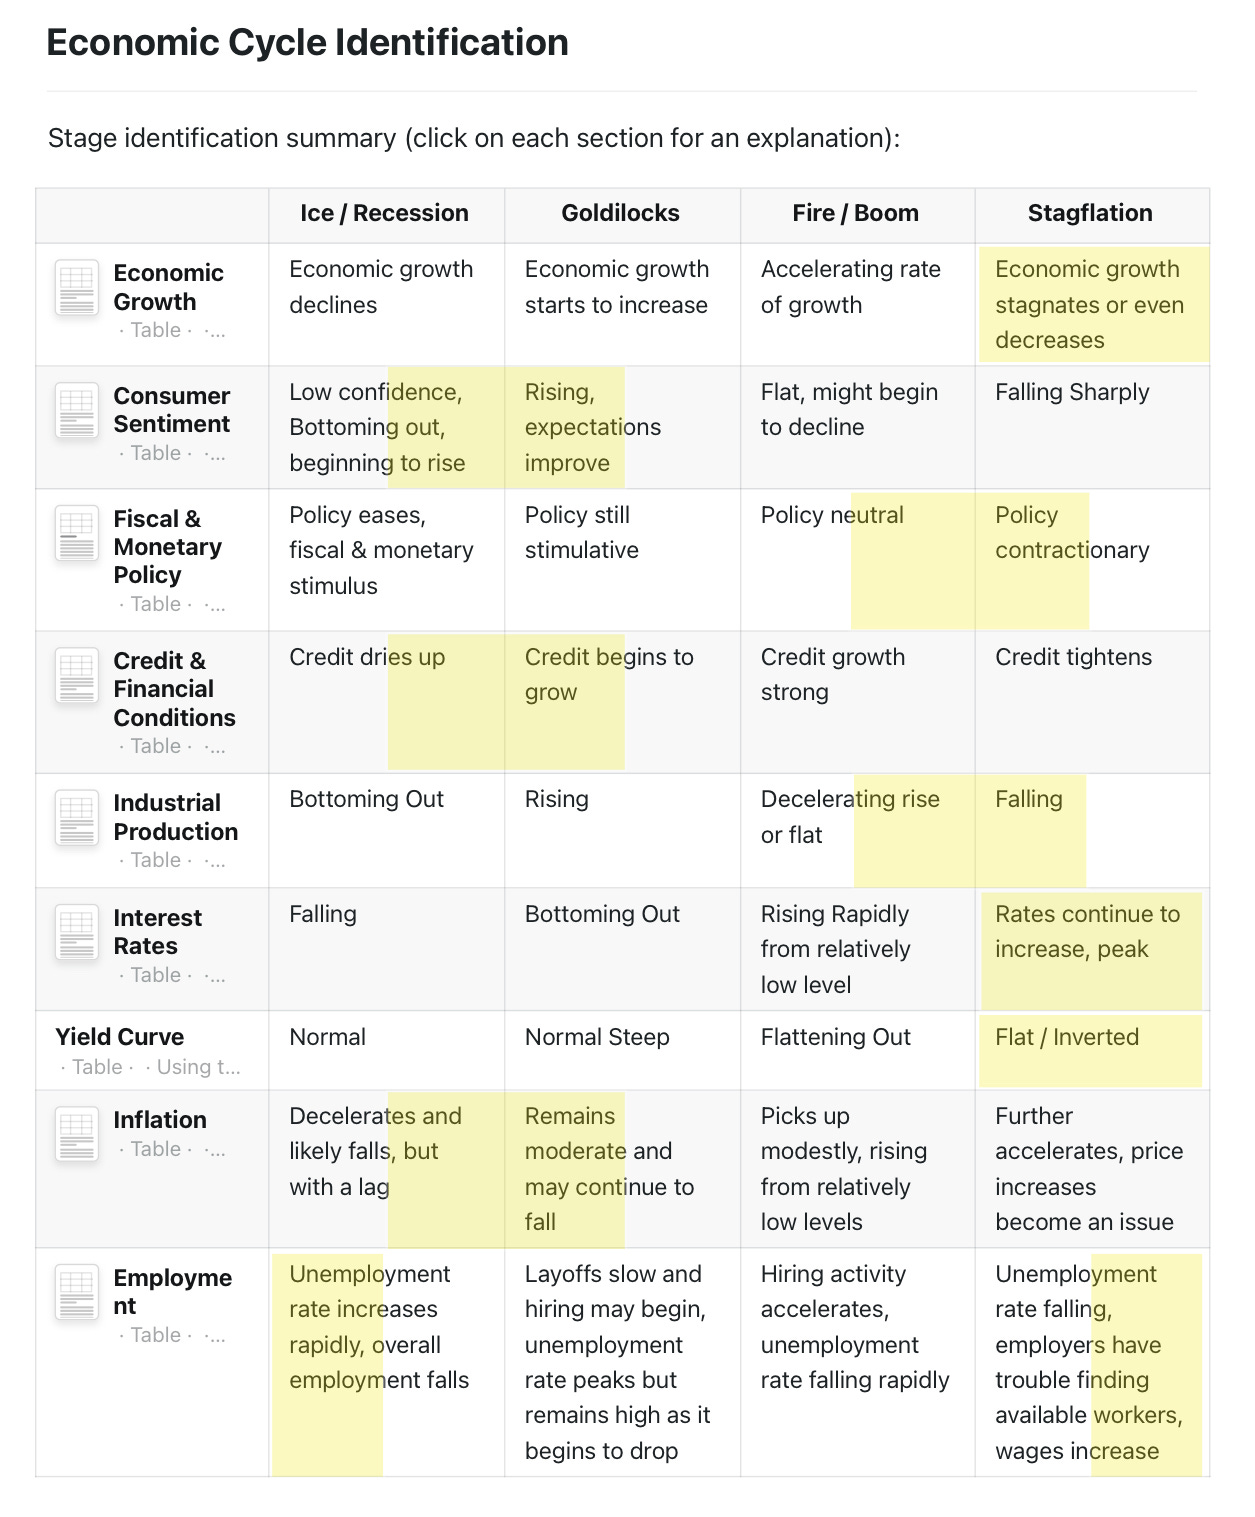
Below is my current guess for the location of each indicator:
Notice that my subjective assessment of each economic indicators current position seems to be all over the place. That is because right now the data truly is inconclusive. This is a difficult environment to navigate. One could make the case for the economy being in then beginning stages of a new growth cycle. Another can easily make a compelling case for the economy sitting on the edge of a deep recessionary period.
Here is what my numbers say:
Stagflation: 4.5 / 9 = 50%
Ice / Recession: 2 / 9 = 22.22%
Goldilocks: 1.5 / 9 = 16.67%
Fire / Boom: 1 / 9 = 11.11%
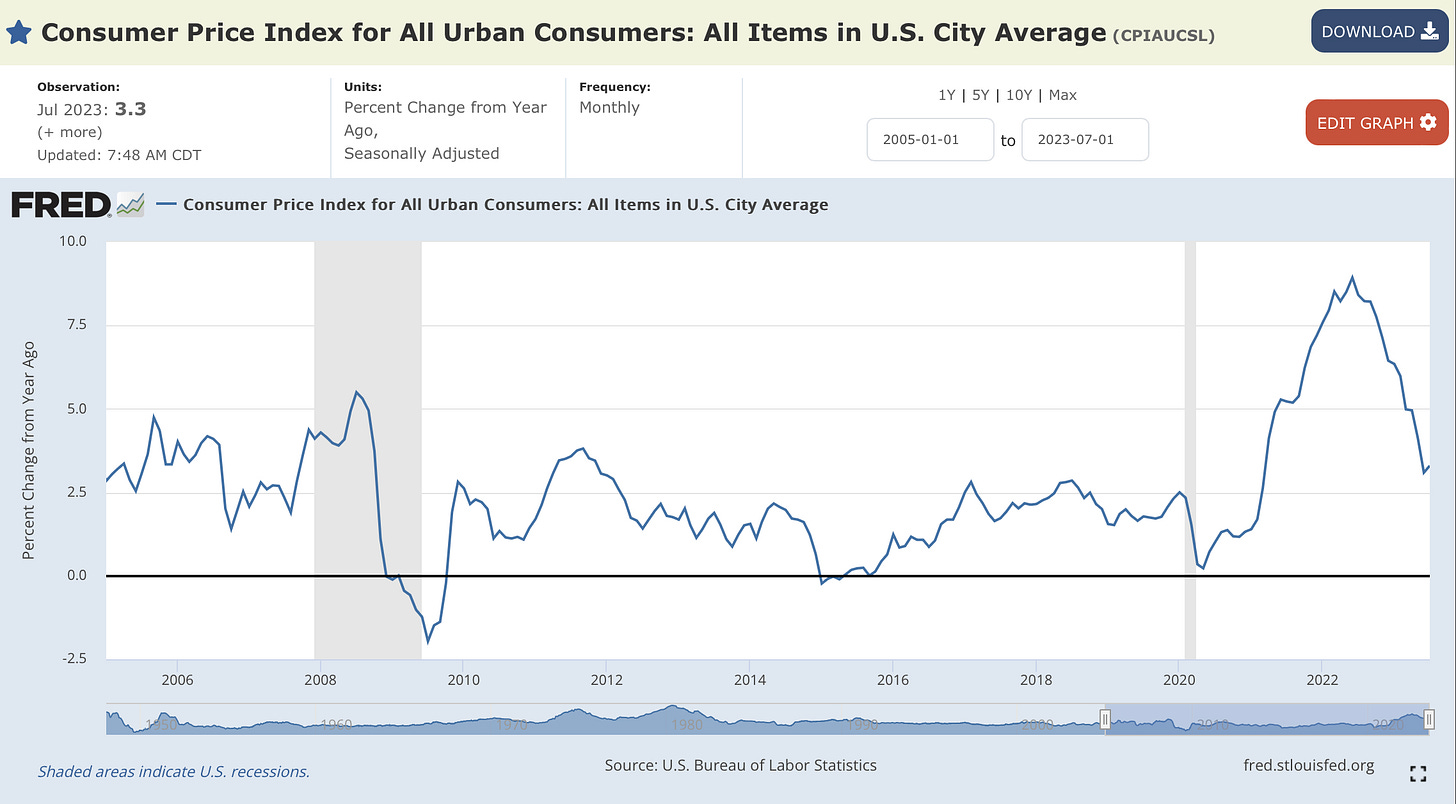
Even though, as you will see below, CPI inflation has fallen from 9% to 3.2% the majority of my economic indicators currently point to the most likely position of the economy as Stagflation. Let’s look again at Fidelity’s description of Stagflation:
“This phase is emblematic of an "overheated" economy poised to slip into recession and hindered by above-trend rates of inflation. Economic growth rates slow to "stall speed" against a backdrop of restrictive monetary policy, tightening credit availability, and deteriorating corporate profit margins. Inventories tend to build unexpectedly as sales growth declines.”
We still have above-trend rates of inflation. Arguably, economic growth is slowing but I would certainly not call it “stall speed”. Monetary policy is restrictive. Banks are tightening lending standards in an attempt to reduce credit availability. Profit margins are under pressure after being at unsustainably high levels and due to demands for wage increases. Inventory to sales ratios continue to increase and sales growth for many firms is negative (Apple) or at stall speeds.
So, it might not seem outwardly obvious that we are in “Stagflation” but we very well could be — which would increase the likelihood that there is a recession or a serious growth slowdown somewhere on the horizon.
Now, let’s walk through each of the indicators I look at to perform this type of analysis.
Economic Growth
The first chart shows two indexes, the leading economic index and the coincident economic index. For the purpose of my stage analysis I am supposed to evaluate the economy as it is now, not what the leading index says it could be soon.
The coincident index tells us how the economy is currently performing. Notice the blue line is still moving up and to the right. In other words, the economy is still growing.
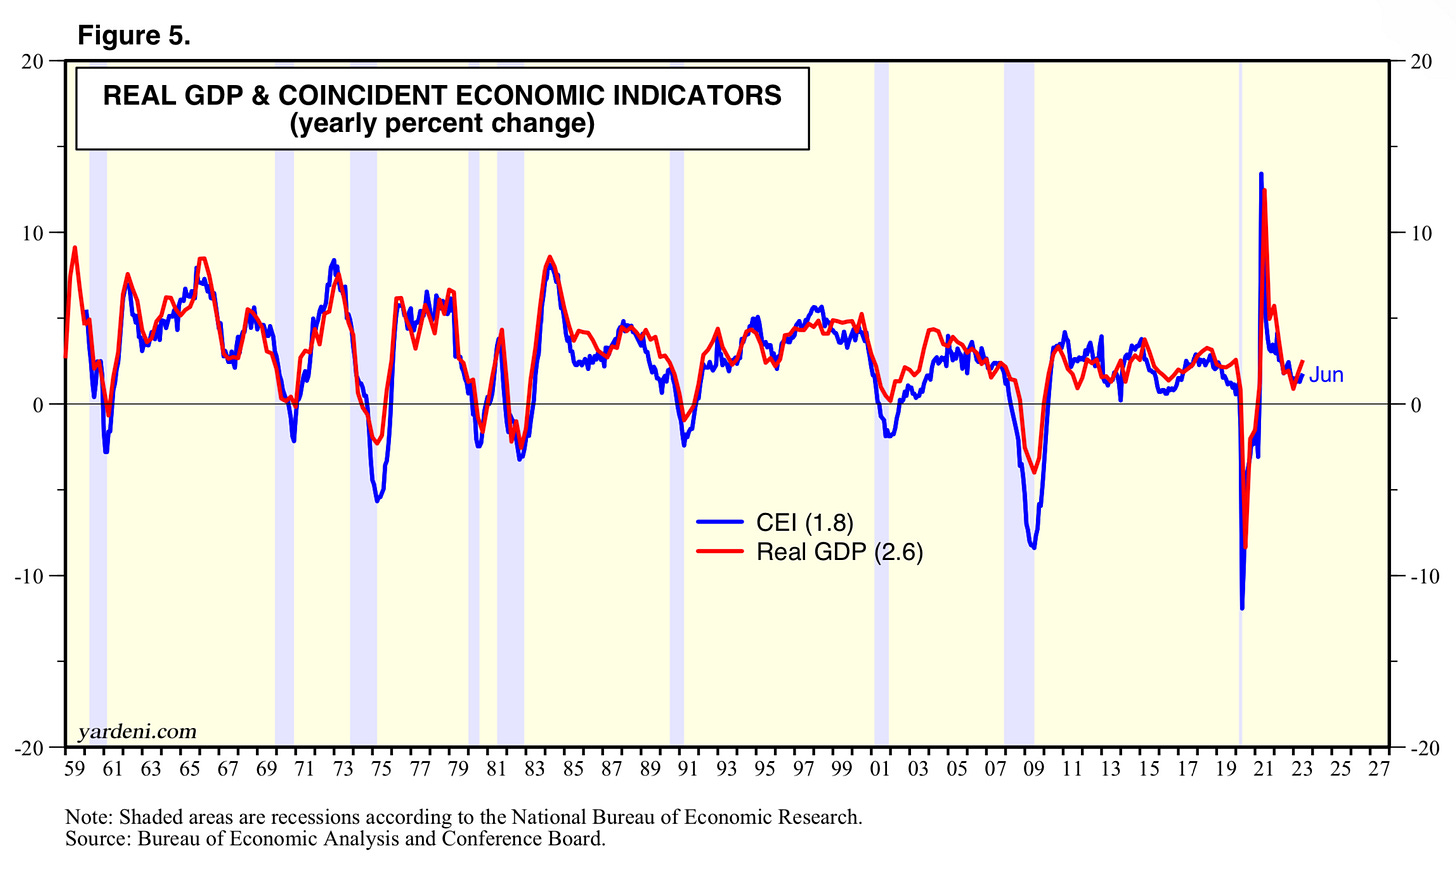
The relationship between the coincident index and real GDP growth is easier to see in the next chart. The growth rates of real GDP and the coincident index have an extremely tight correlation. Currently, the coincident index remains in positive territory.
The Atlanta Fed’s GDPNow measure is also in positive territory. This indicator does a great job predicting what the real GDP growth rate is going to be for the current quarter. From the Atlanta Fed:
The GDPNow model estimate for real GDP growth (seasonally adjusted annual rate) in the third quarter of 2023 is 4.1 percent on August 8, up from 3.9 percent on August 1.
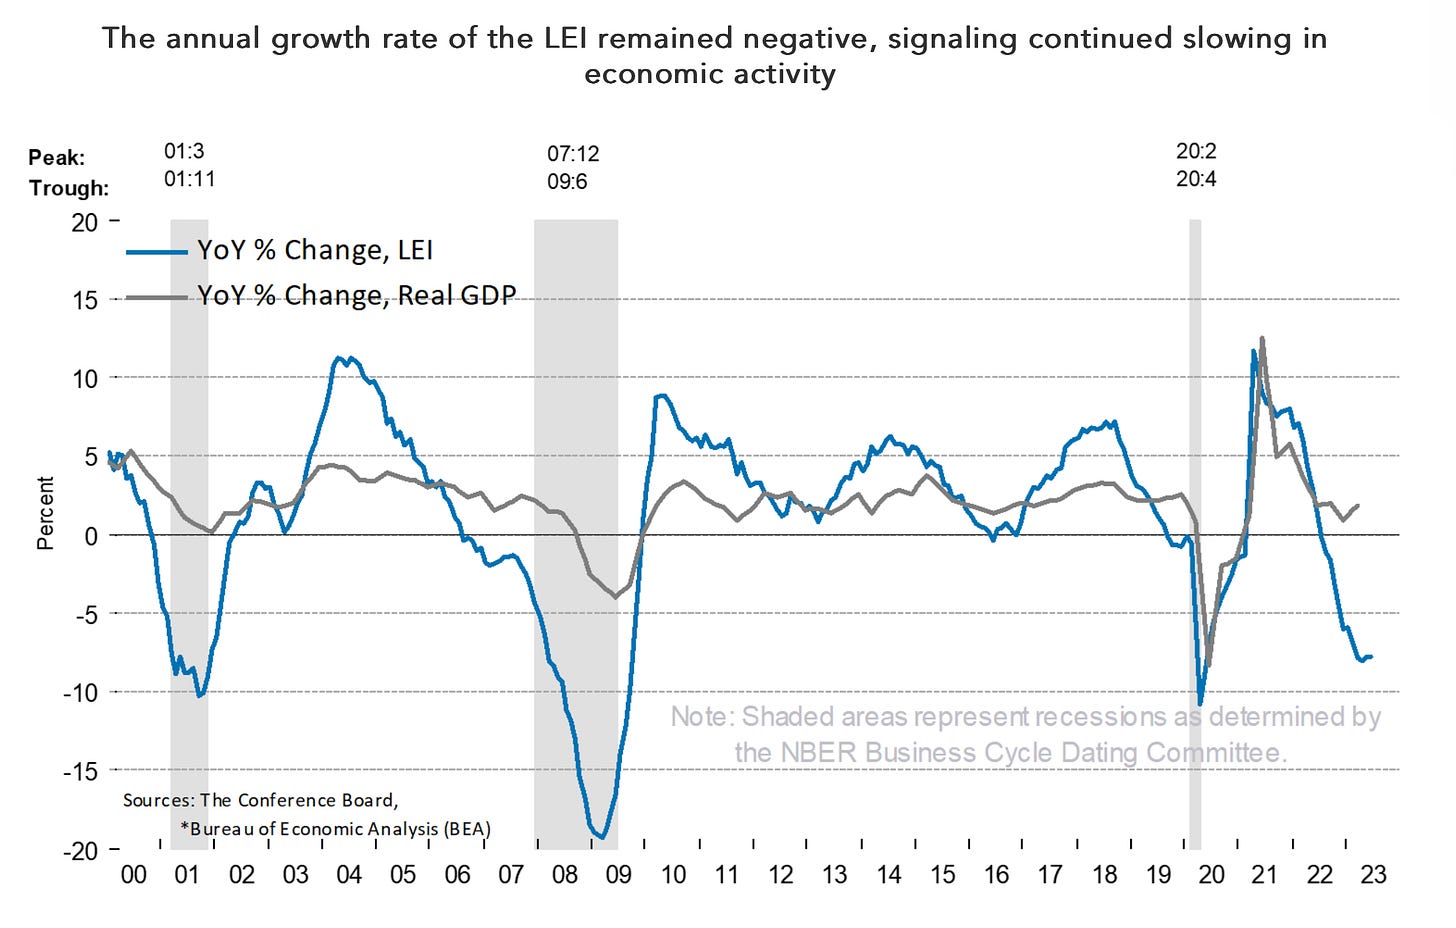
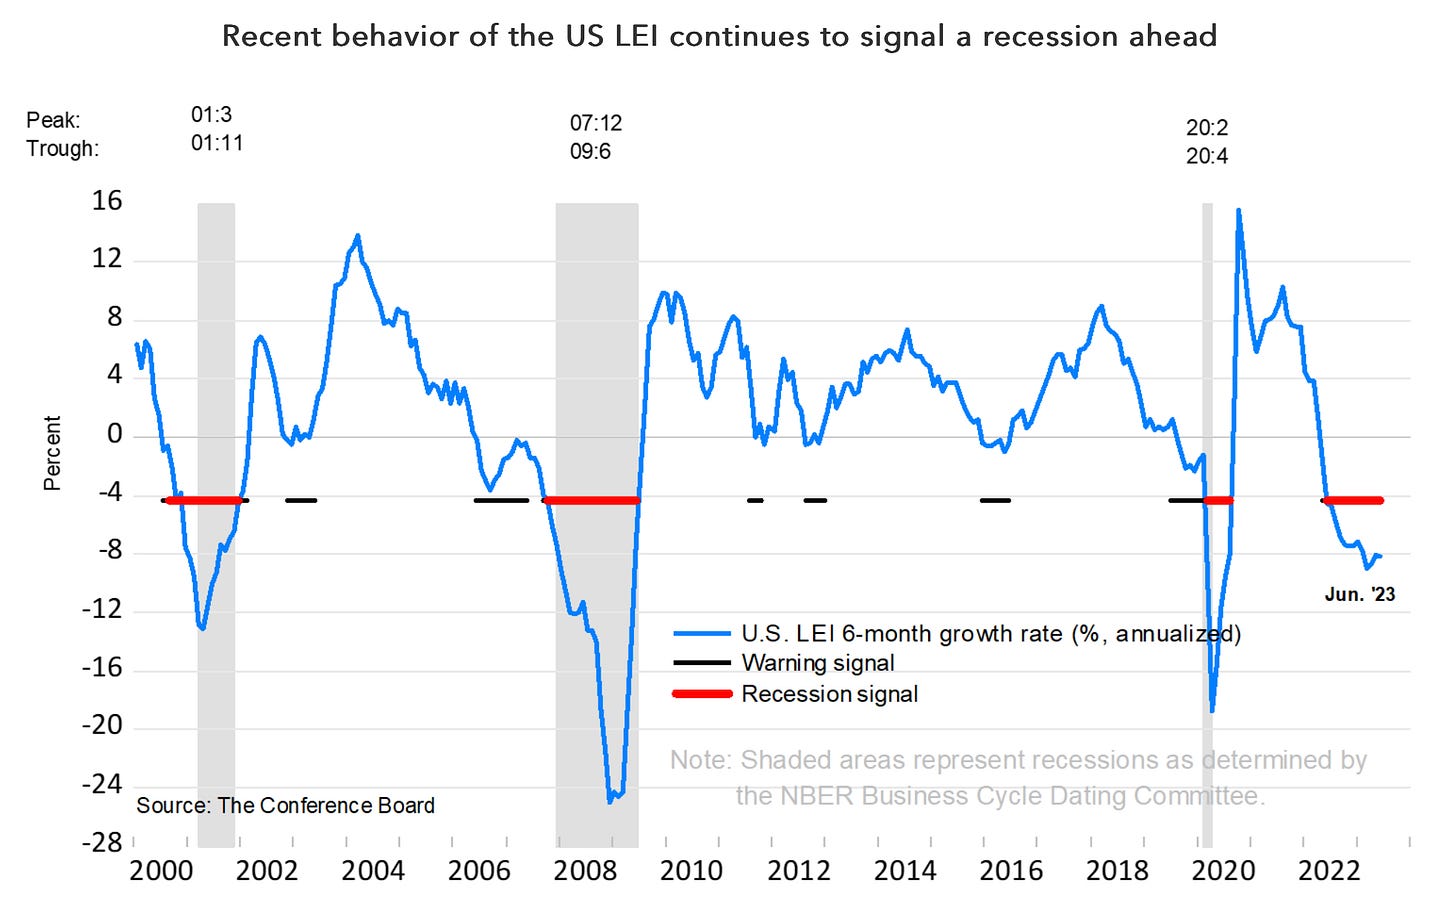
As you likely saw in the first economic growth chart, the leading indicator index was moving down quickly. The next couple of charts analyze The Conference Boards Leading Economic Index for the United States.
From Justyna Zabinska-La Monica, Senior Manager, Business Cycle Indicators, at The Conference Board:
“The Leading Index has been in decline for fifteen months—the longest streak of consecutive decreases since 2007-08, during the runup to the Great Recession. Taken together, June’s data suggests economic activity will continue to decelerate in the months ahead. We forecast that the US economy is likely to be in recession from Q3 2023 to Q1 2024. Elevated prices, tighter monetary policy, harder-to-get credit, and reduced government spending are poised to dampen economic growth further.”
This next chart looks at the 6 months growth rate in the leading index. When a large % of the components that make up the index are trending lower and the 6 month growth rate of the index is below -4%, it triggers a recession warning. We are now under one of these warnings.
Conclusion: The economy continues to experience positive growth but there are storm clouds on the horizon.
Consumer Sentiment
Why monitor sentiment? From Jennifer Nash at Advisor Perspectives:
The general assumption is that when consumers are more optimistic they will spend more and stimulate economic growth. However, if consumers are pessimistic then spending will decline and the economy may slow down.
The University of Michigan Consumer Sentiment Index bottomed in mid-2022 and has since been in a steady uptrend as inflation peaked at 9% in summer 2022 and has since declined back to 3%.
The Conference Board Consumer Confidence Index also remains in an uptrend.
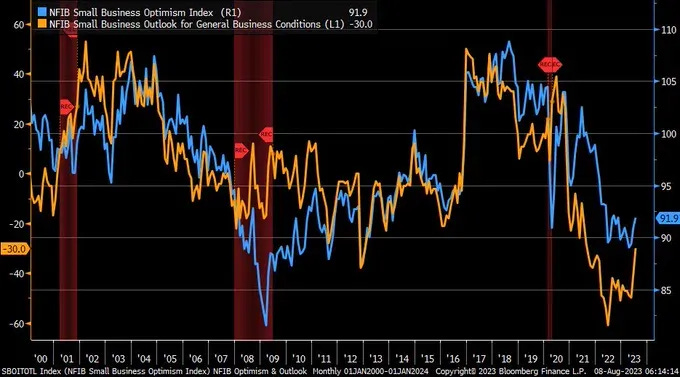
Another measure of sentiment is the NFIB Small Business Optimism Index (blue line). It appears as though this index may have bottomed recently and is now moving higher. The Small Business Outlook for General Business Conditions (orange line) bottomed in mid-2022 and is now accelerating to the upside.
Conclusion: COVID-19 led to extreme pessimism. Now that inflation has returned to levels close to normal and COVID-19 is no longer something that impacts the psyche of the average American, some level of optimism is returning to consumers and businesses.
Fiscal & Monetary Policy
The next section of the model attempts to measure the current status of monetary and fiscal policy.
Monetary policy is determined by the central bank. Let’s examine it first.
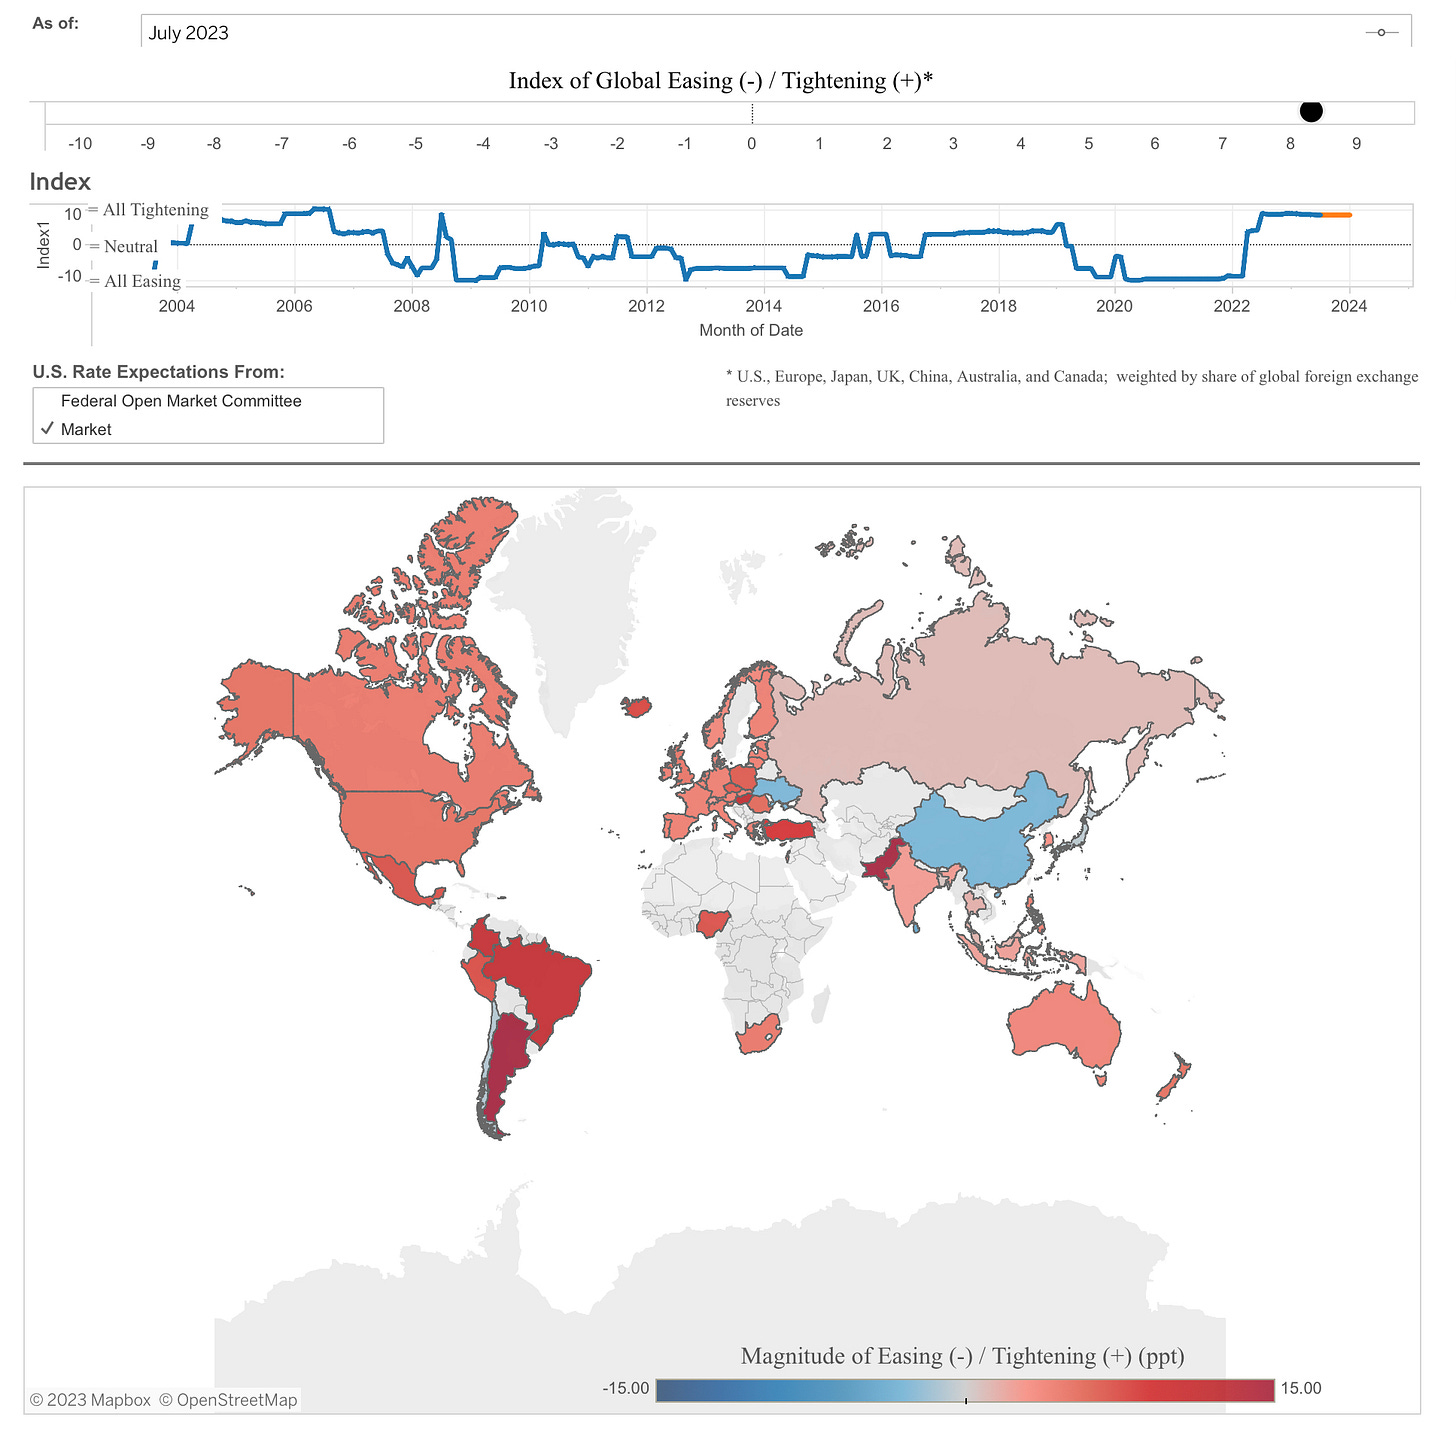
Here is some information about CFR’s Global Monetary Policy Tracker:
CFR’s Global Monetary Policy Tracker compiles data from 54 countries around the world to highlight significant global trends in monetary policy.
The CFR index weights the 54 countries by its % share of global foreign exchange reserves. Therefore, the United States is more than 60% of the weight of the 54 country index.
A country is said to be easing (tightening) policy if it has cut (raised) rates in the past three months, or is expected to do so in the next three months. A country is also said to be easing if it is engaged in QE.
It is clear from the index, as well as the country heat map, that monetary policy is now overwhelmingly restrictive as the majority of central banks are engaged in policy tightening. Only China and Ukraine stand out as easing policy.
Now on to fiscal policy. Fiscal policy is determined by the government. In the United States this includes the Federal government, Congress, as well as state and local governments. The combination of all three can be considered fiscal policy.
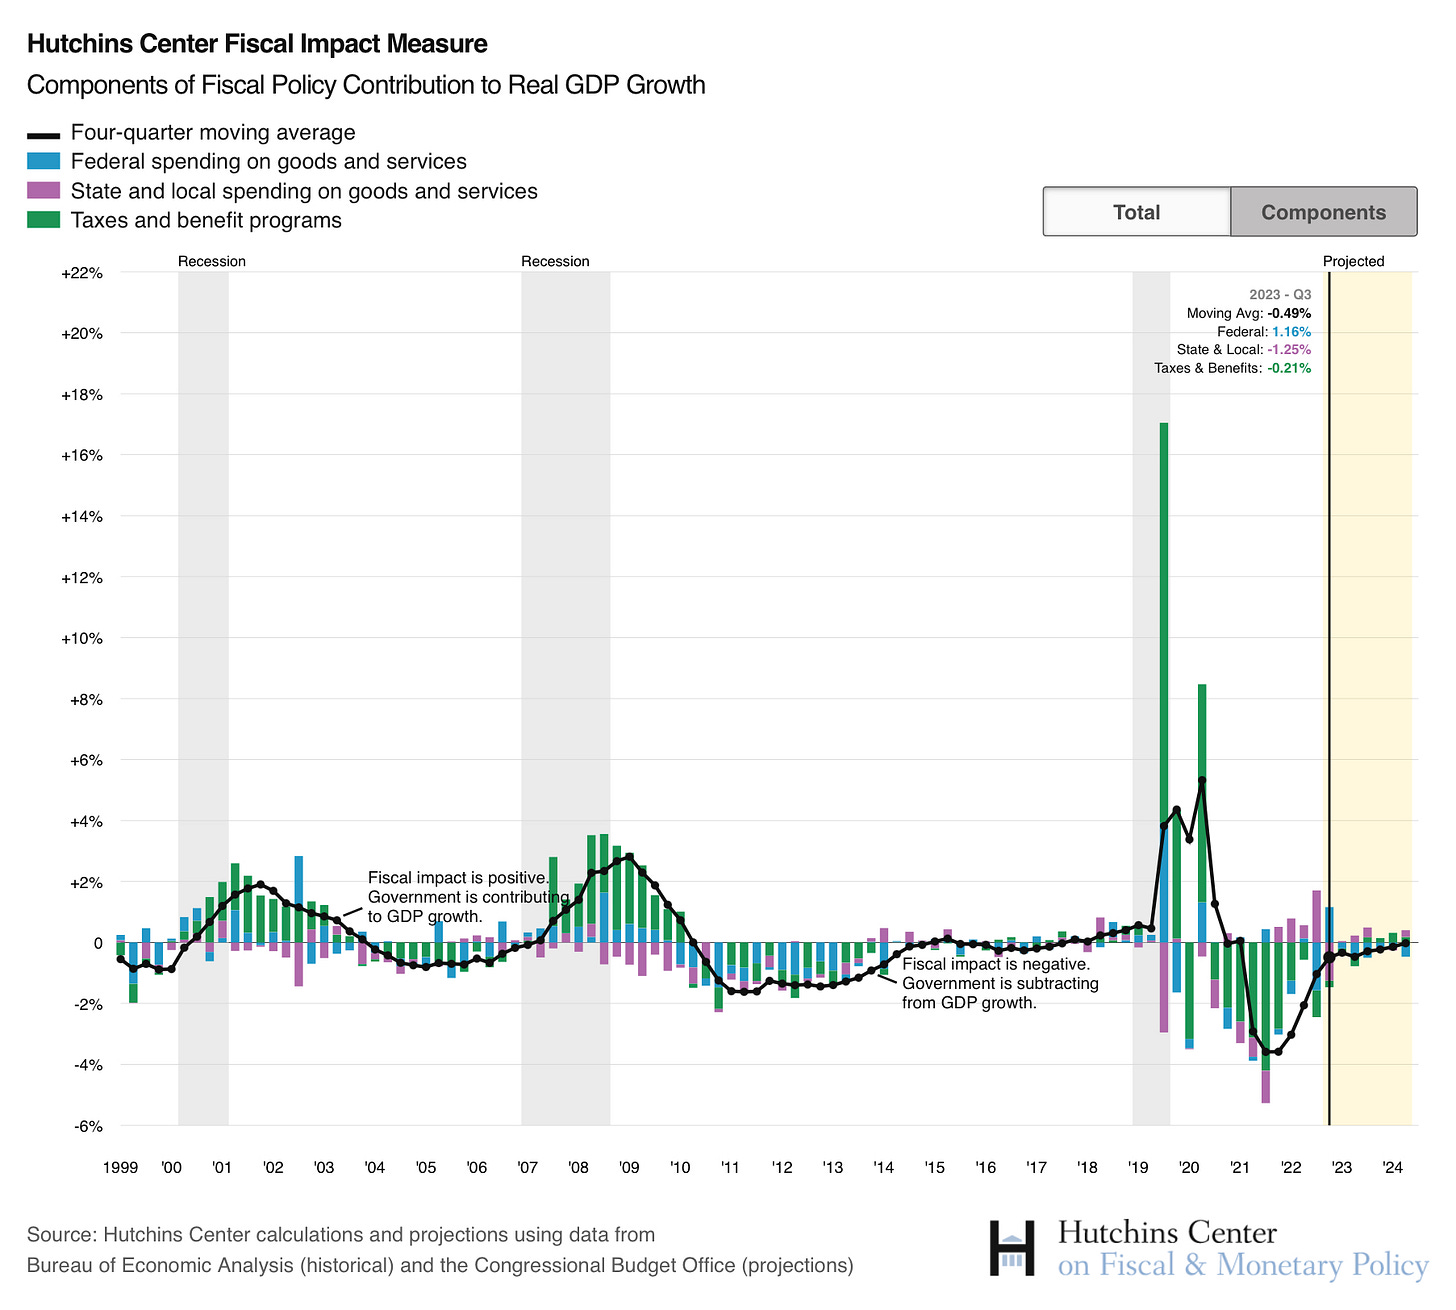
The first measure is the Hutchins Center Fiscal Impact Measure. Here is how they explain it:
The Hutchins Center Fiscal Impact Measure shows how much local, state, and federal tax and spending policy adds to or subtracts from overall economic growth, and provides a near-term forecast of fiscal policies’ effects on economic activity.
Currently, for Q3 2023, state and local governments are expected to subtract approximately 1.25% from real GDP growth even as the Federal government’s spending is expected to add 1.16%. Overall, fiscal policy is expected to have a minor negative impact on real GDP growth this coming quarter and the projection for the next couple year is neutral.
How is the Federal government contributing so much to real GDP growth? Let’s take a deeper look. In the next chart we can see the Federal budget deficit for 2023 is much higher than any “non-emergency” year in history, only eclipsed by the COVID emergency years of 2020 and 2021.
Cumulative FY23 Deficit: $1.4 trillion
Cumulative FY22 Deficit: $515 billion
Federal deficit spending so far in 2023 is $885 billion more than in 2022. Needless to say this is unsustainable and is one of the primary reasons why Fitch just downgraded the credit rating of the United States government.
However, for the purposes of this analysis politics is not of concern. What I care about is the impact of fiscal policy on the economy. The method chosen to finance the Federal government’s historically extreme levels of spending will determine the impact it has on the economy.
If the government chooses to finance its additional spending with increased tax revenues, it typically has a muted effect as it is simply robbing Peter to pay Paul. In essence, no additional money is being spent.
Where this additional Federal spending does have an enormous stimulative impact is when the government finances the spending with debt. This is like pulling spending from the future into the present. Yes, it matters who is financing the debt, but if the debt is purchased using savings that were unlikely to be spent in the first place it will have the effect of raising the current level of aggregate demand in the economy.
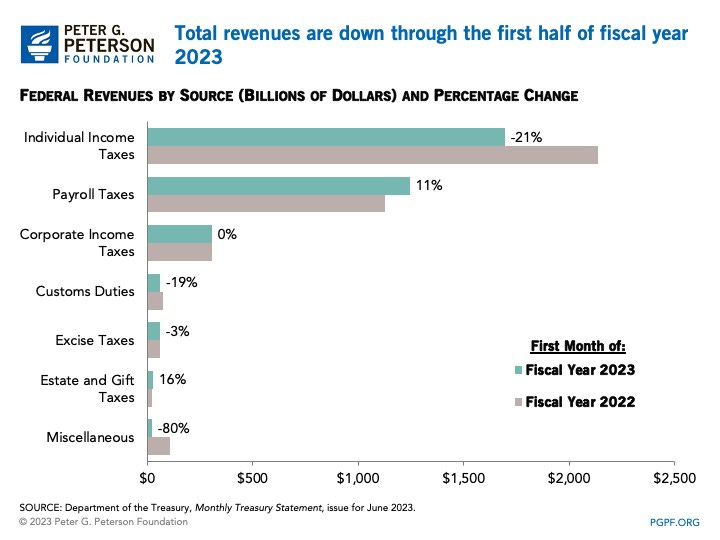
Take a look at the chart below. Overall tax revenues are down compared to last year. The government has spent $885 billion more than in 2022 and financed it with less tax revenue. The difference has had to be borrowed. This is stimulative and is the reason Federal spending is having a positive impact on real GDP growth.
Conclusion: The Federal Reserve’s policy is extremely contractionary but this is being offset by extreme levels of borrowing and spending out of Washington D.C. Overall though, I think fiscal and monetary policy is neutral to tight.
Credit & Financial Conditions
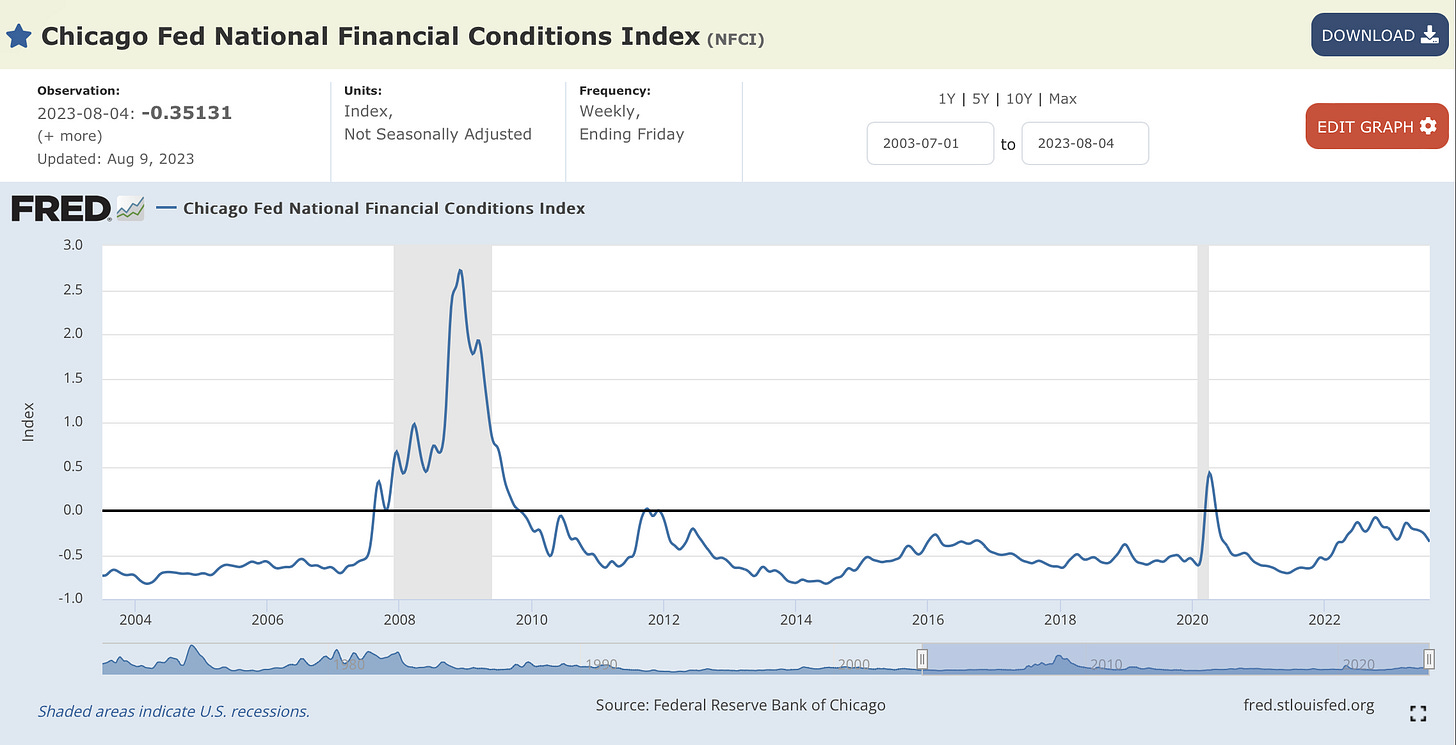
The first item I like to look at when analyzing credit & financial conditions is the Chicago Fed National Financial Conditions Index (NFCI).
The Chicago Fed's National Financial Conditions Index (NFCI) provides a comprehensive weekly update on U.S. financial conditions in money markets, debt and equity markets and the traditional and "shadow" banking systems. Positive values of the NFCI indicate financial conditions that are tighter than average, while negative values indicate financial conditions that are looser than average.
The NFCI has been trending lower since the October and March peaks. This indicates improving financial conditions.
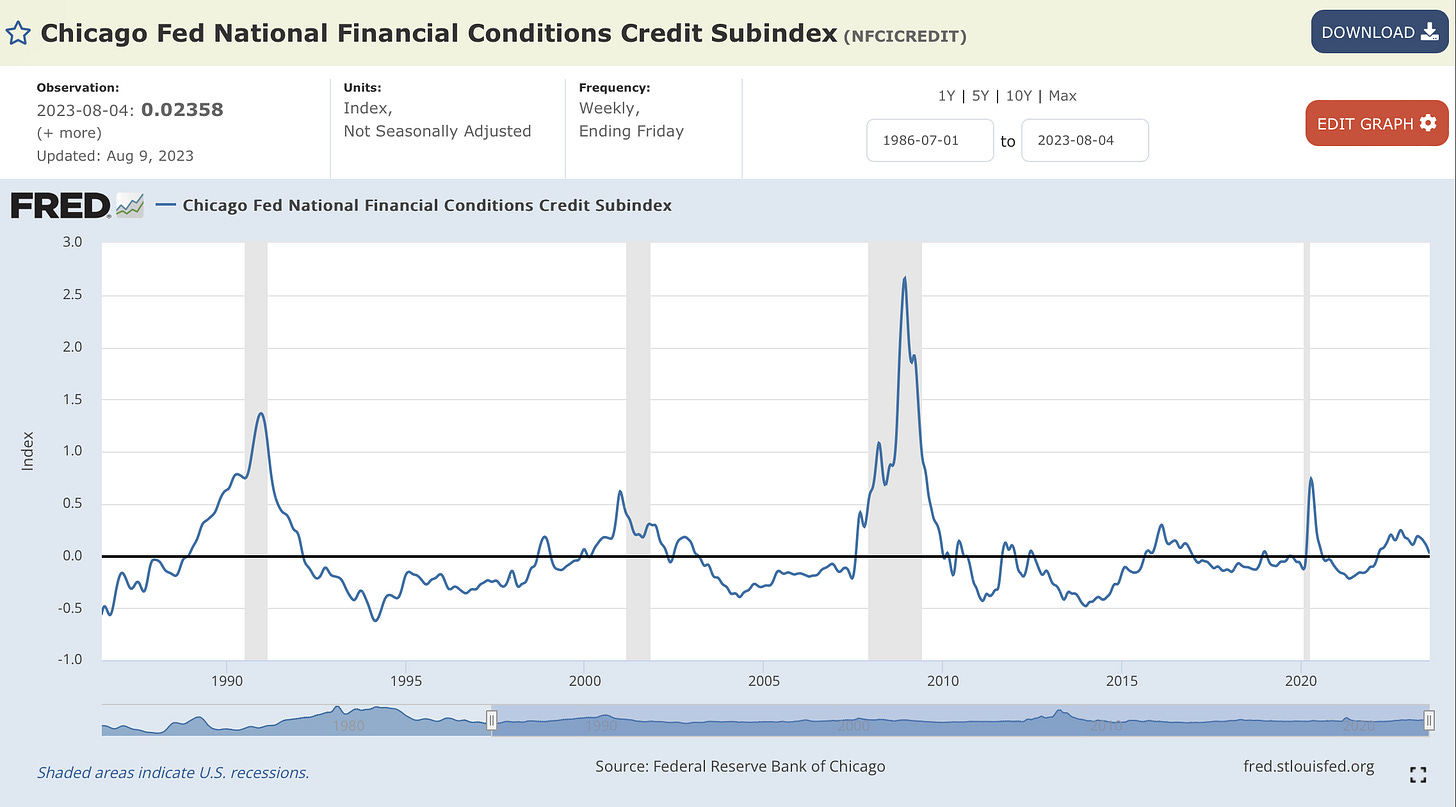
The Credit Subindex of the NFCI is also declining, although it is still above 0. In other words, credit conditions are tight but they are improving.
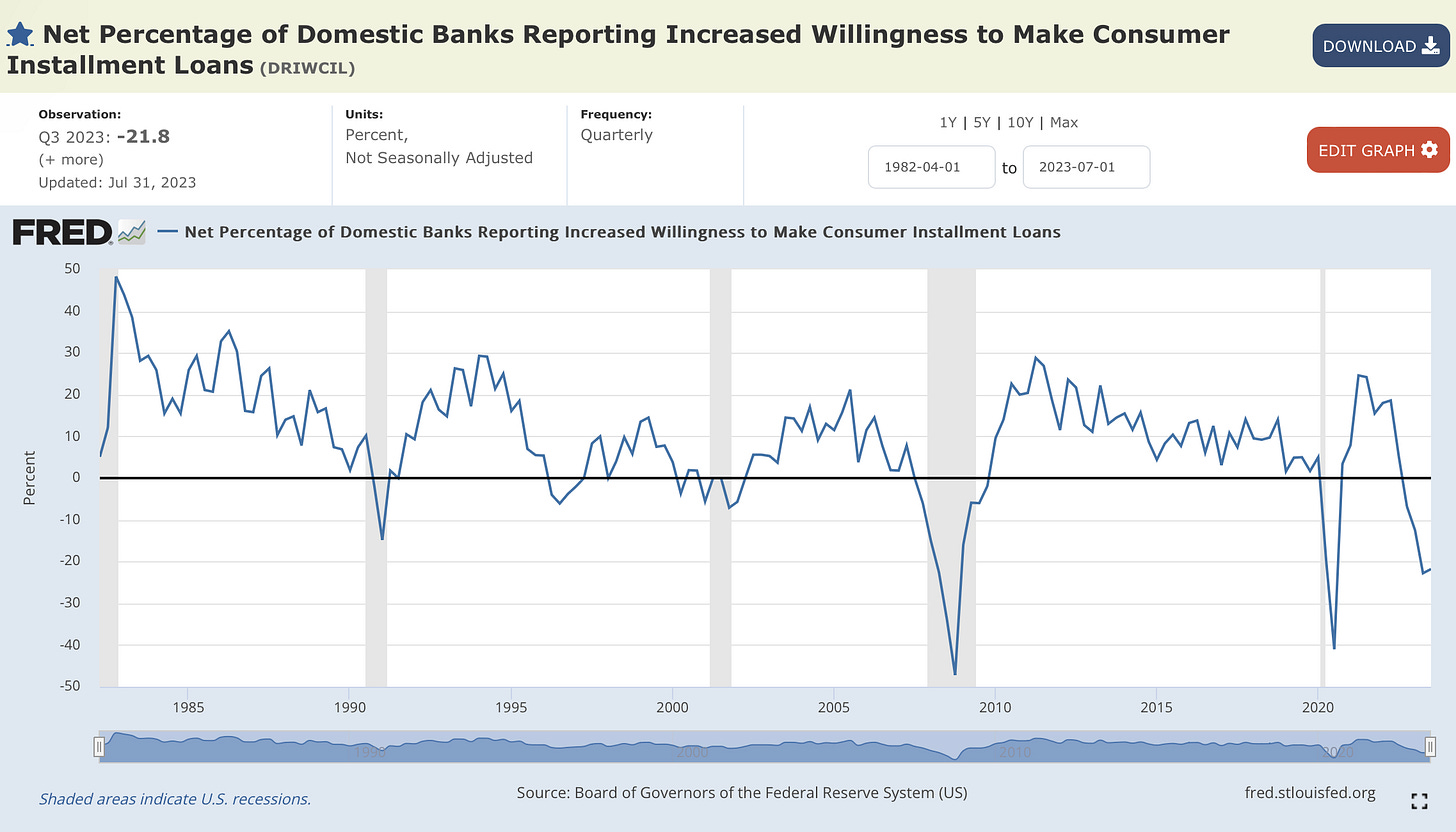
However, when we look at the results of banking industry surveys, we find an unwillingness to lend. This should have the effect of tightening credit conditions by making it more difficult for consumers and businesses to borrow money.
Below we see the % of domestic banks reporting an increased willingness to make consumer installment loans is near the lowest levels since the early-1980s. This is consistent with other periods of poor credit & financial conditions.
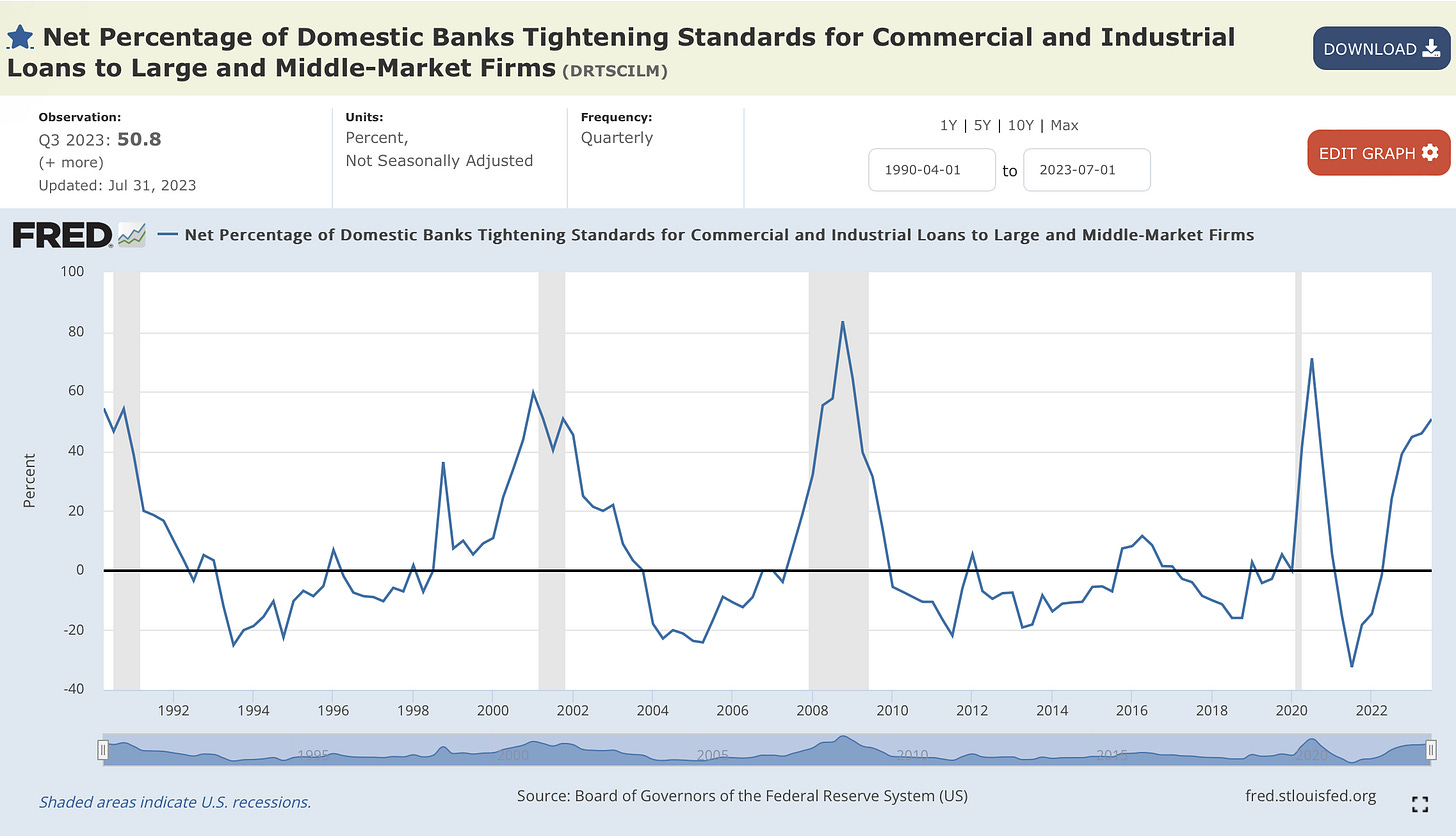
Looking at the business sector, we see banks also seem to be more hesitant here as well. The percentage of banks that are tightening lending standards for business loans has reached historically extreme levels. As with consumer loans, this tightening of lending standards should ultimately result in a tightening of credit & financial conditions and ultimately less credit creation.
Conclusion: It’s possible the decrease in the willingness to make consumer loans and the increase in lending standards for businesses has not yet resulted in a major change to the amount of loan approvals. In other words, there is a lag effect and what we see in the prior two charts has not yet resulted in a major tightening of credit & financial conditions.
Industrial Production
Industrial Production is a relatively easy indicator to measure and “grade” for my economic stage model.
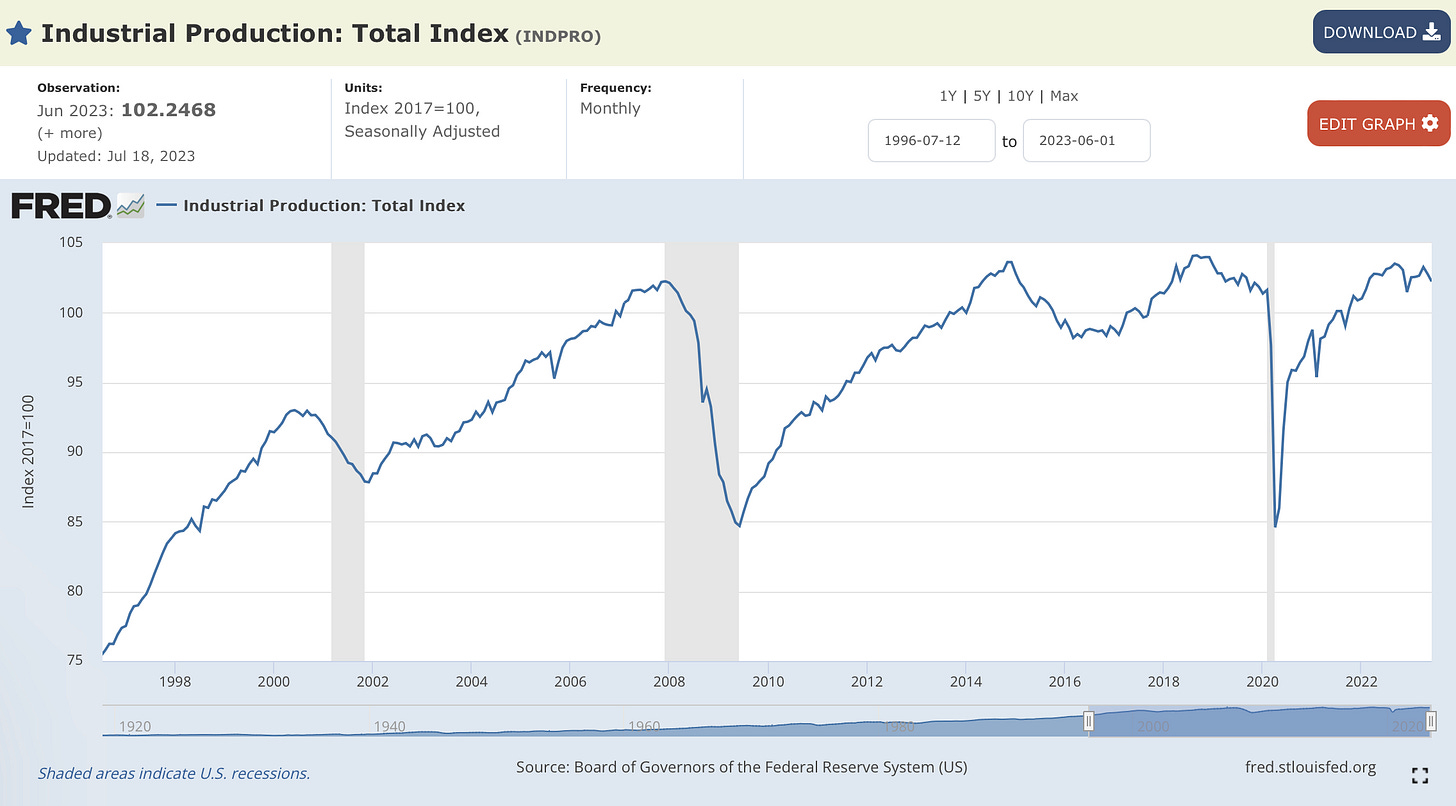
The first chart shows that the index appears to be declining. However, it is at the same level now that it was about 2 years ago, indicating some sideways movement / stagnation.
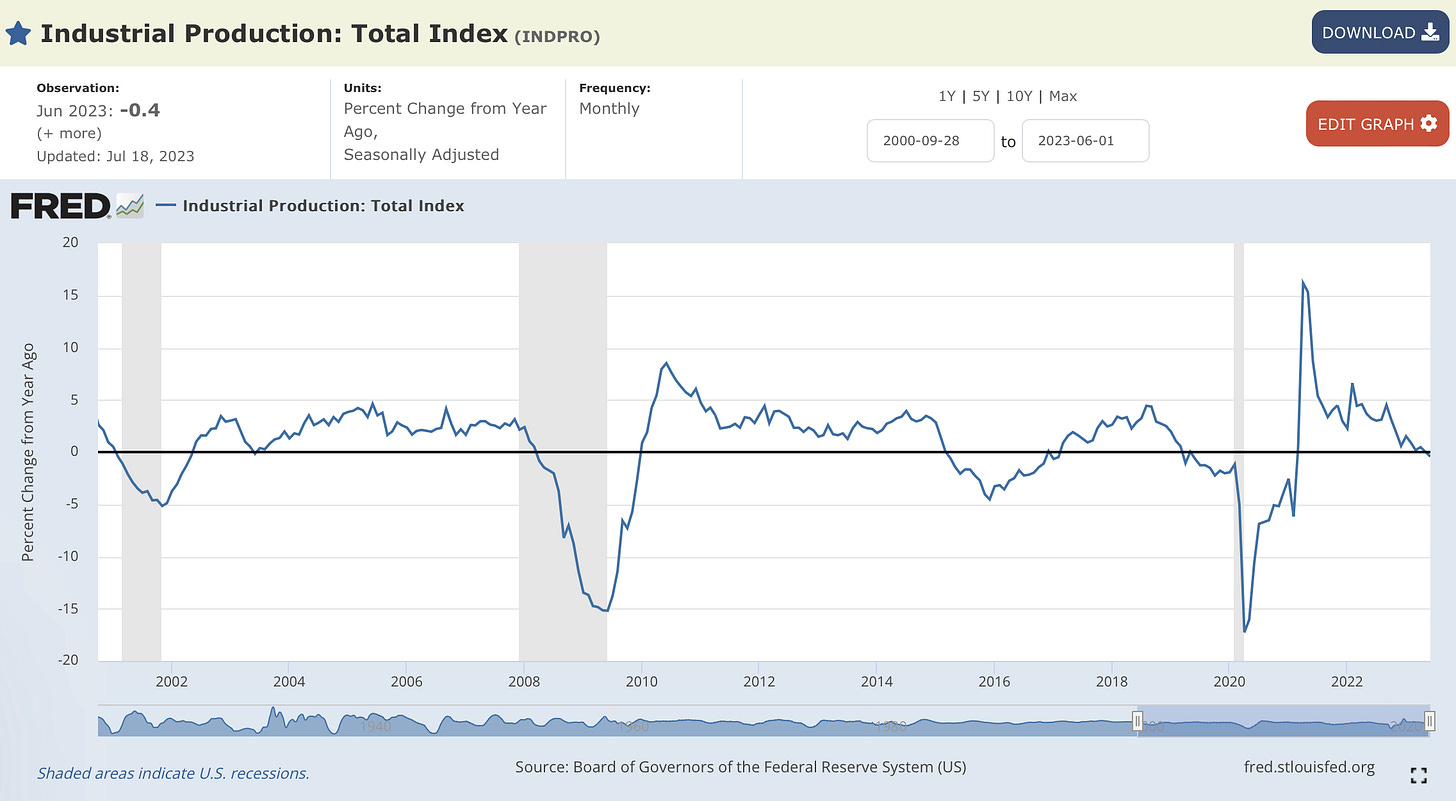
Looking at the YoY growth rate of the industrial production index, we can confirm that the index is indeed now in decline.
Conclusion: The rise in the industrial projection index seen post-COVID has clearly stalled out and it now appears that industrial production is in decline.
Interest Rates
The Federal Funds Rate continues to increase. There is talk that the Fed will pause at their next meeting. This may be true. But for now the trend in rates remains up.
Conclusion: The Fed continues their fight against inflation by maintaining a Fed Funds Rate above then natural rate of interest. This should be contractionary for economic activity.
Yield Curve
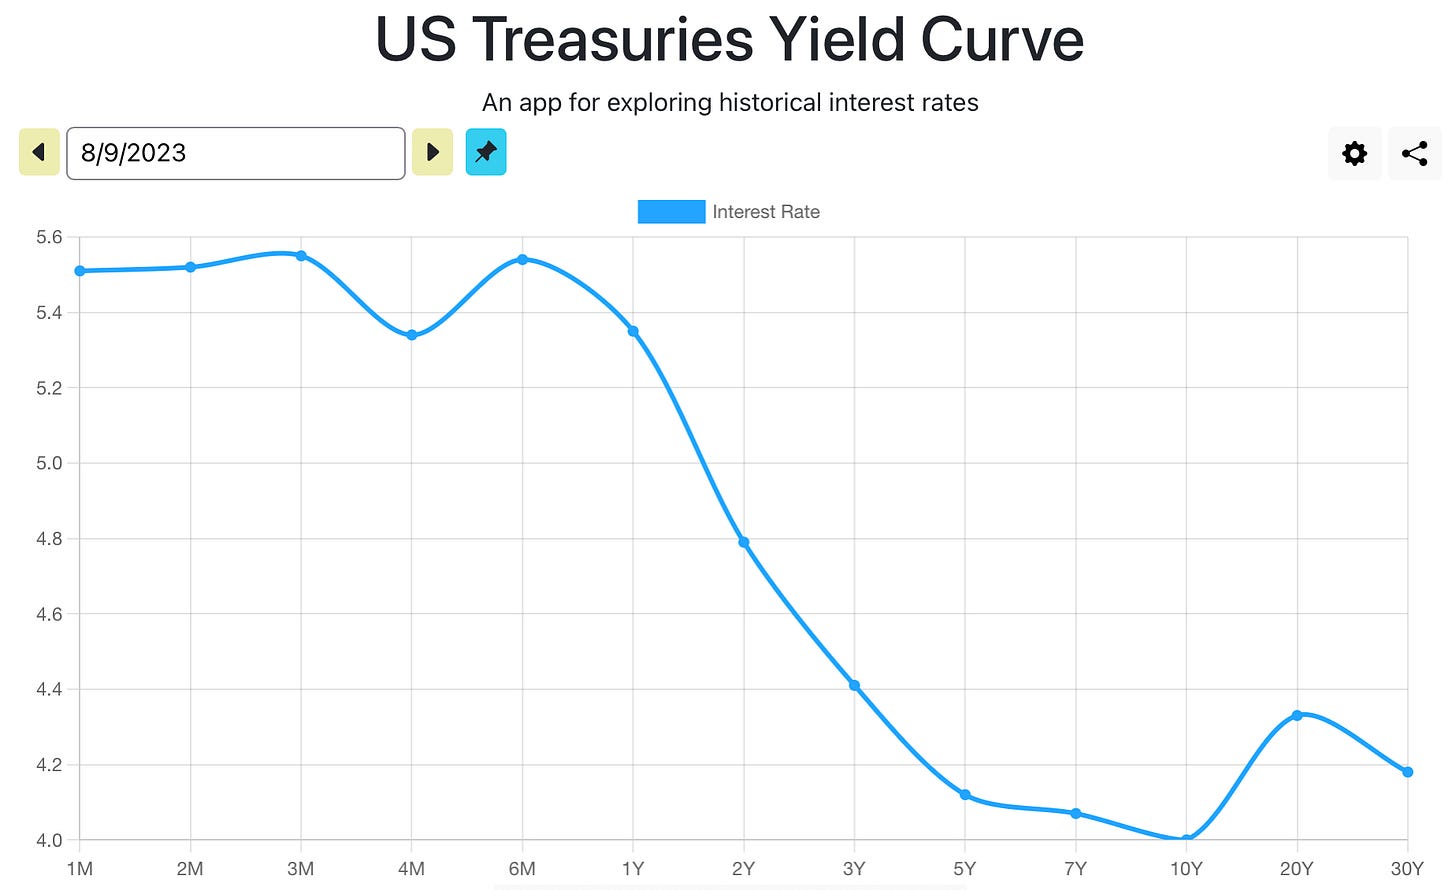
The Yield Curve has been at and remains in one of the most inverted positions it has ever seen. Short term rates remain far above long term rates.
Conclusion: The Yield Curve remains flat / inverted. This encourages saving in liquid assets and discourages the deployment of capital for long-term fixed investments.
Inflation
Today’s inflation print of 3.2% is the first rise in the YoY growth rate of the CPI in nearly a year. However, this number was barely an increase and still came in below expectations for 3.3%.
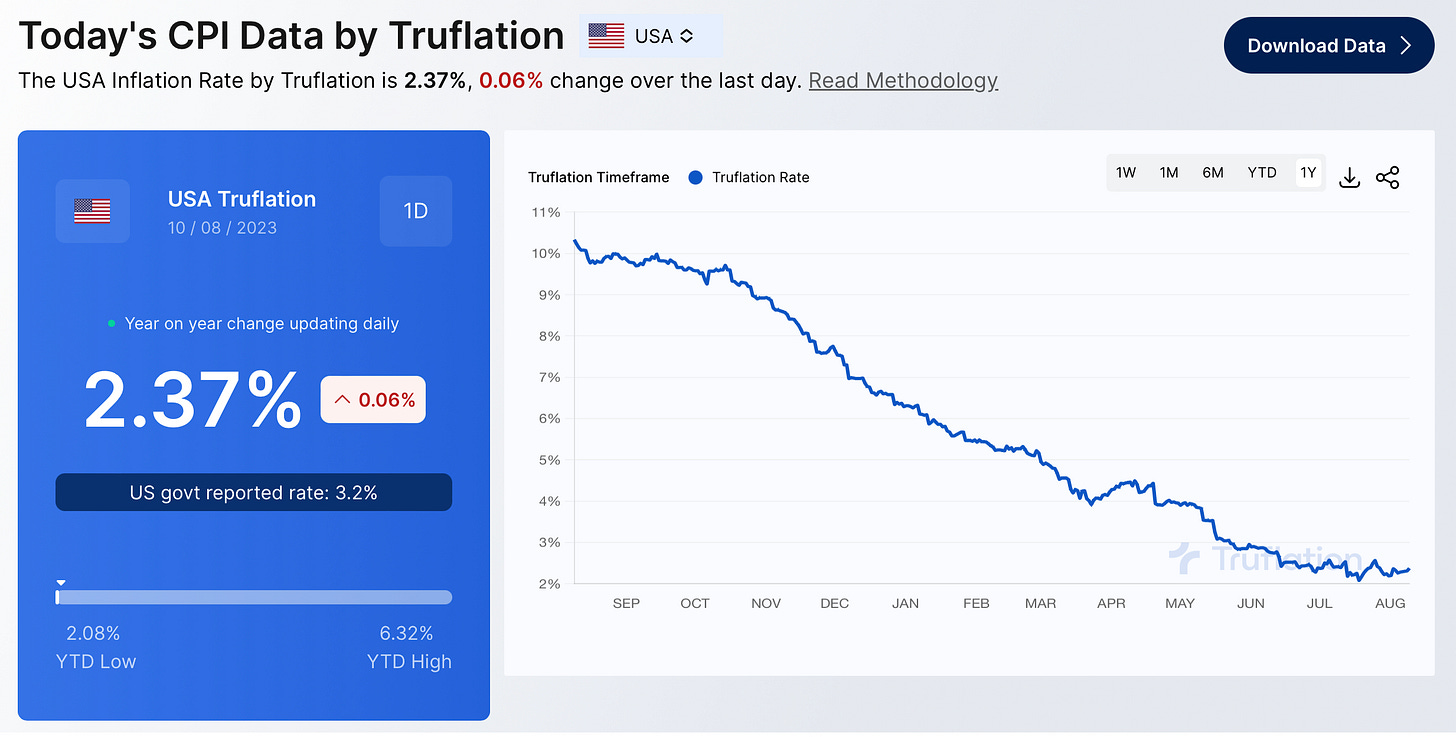
The Truflation Index continues to point to a true inflation rate below the Federal Reserve’s target of 2.5%. However, this index seems to have stabilized around the 2.4% level and has been moving sideways since June after a long period of decline.
Conclusion: The downtrend in inflation may be stalling out but the current level of inflation, while still above trend when using the CPI, is no where near the problematic levels experienced during the first half of 2022.
Employment
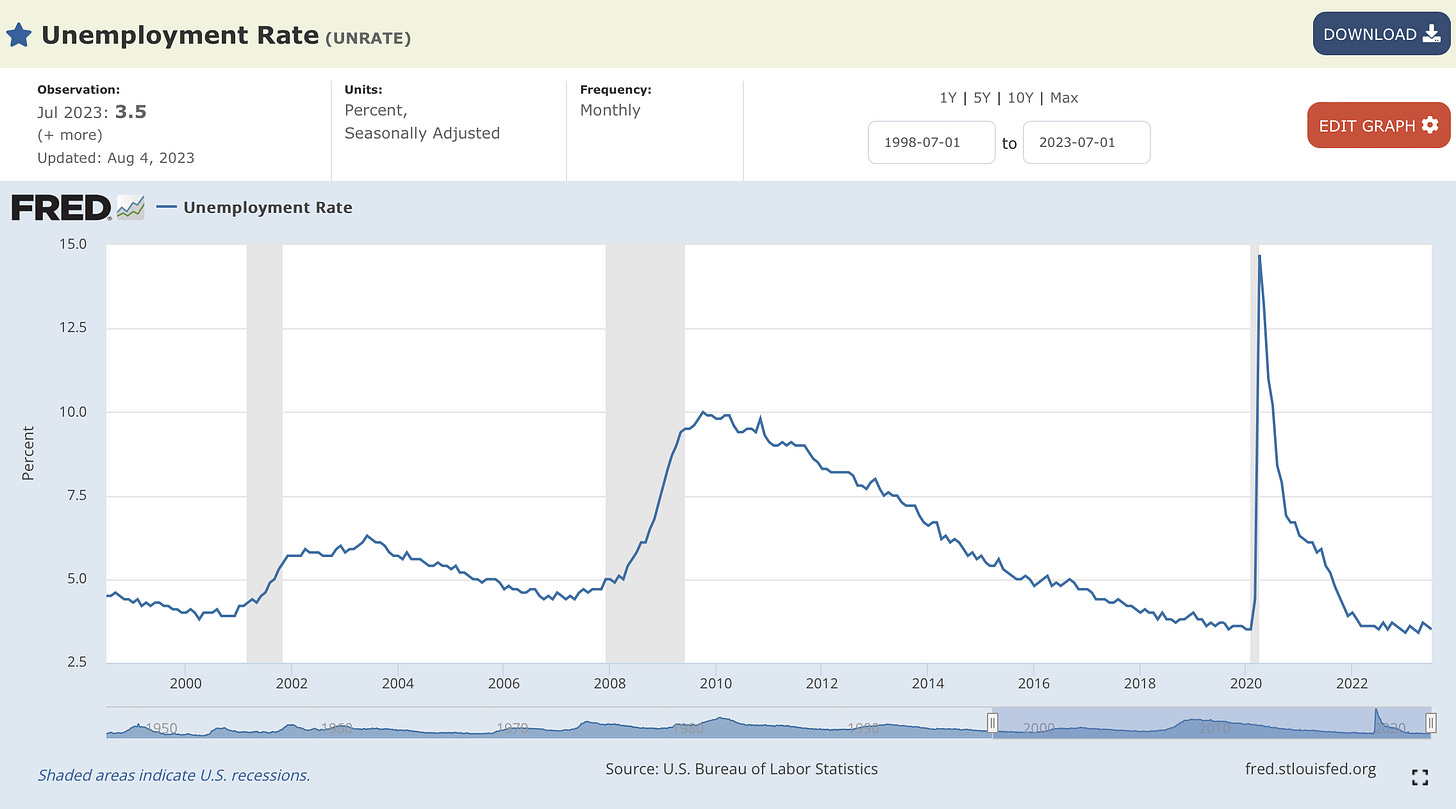
The most widely used method for understanding the health of the labor market is an analysis of the Unemployment Rate. The latest figure was 3.5%. This is near historic lows and the unemployment rate has been trending sideways near this level for a little over a year.
The Unemployment Rate is a coincident indicator, providing a look at what the economy is doing in the present. Some would even say the unemployment rate is lagging.
For a more timely look at the labor market we can look at initial unemployment claims. Initial claims data measures the number of individuals who filed for unemployment insurance for the first time during the past week. This data series does not appear as healthy as the unemployment rate. It has been moving higher since October 2022.
From Jennifer Nash at Advisor Perspectives:
Notice the relationship between recessions and the rise in weekly unemployment claims. The 4-week moving average begins to rise at or before the start of a recession and reaches a relative peak at the end of a recession. The latest trend in the 4-week moving average shows weekly initial jobless claims have been trending upwards since October of last year. Could this mean we are headed towards another recession?
Another timely, and maybe forward looking, indicator of the labor market is Job Openings. The number of job openings peaked in March 2022 and has been in a downtrend ever since. Less job openings indicates a weaker labor market.
However, it’s important to point out that there are still more job openings today than there were prior to COVID. So, while job openings are trending in the wrong direction, the amount of jobs available is till near historic highs.
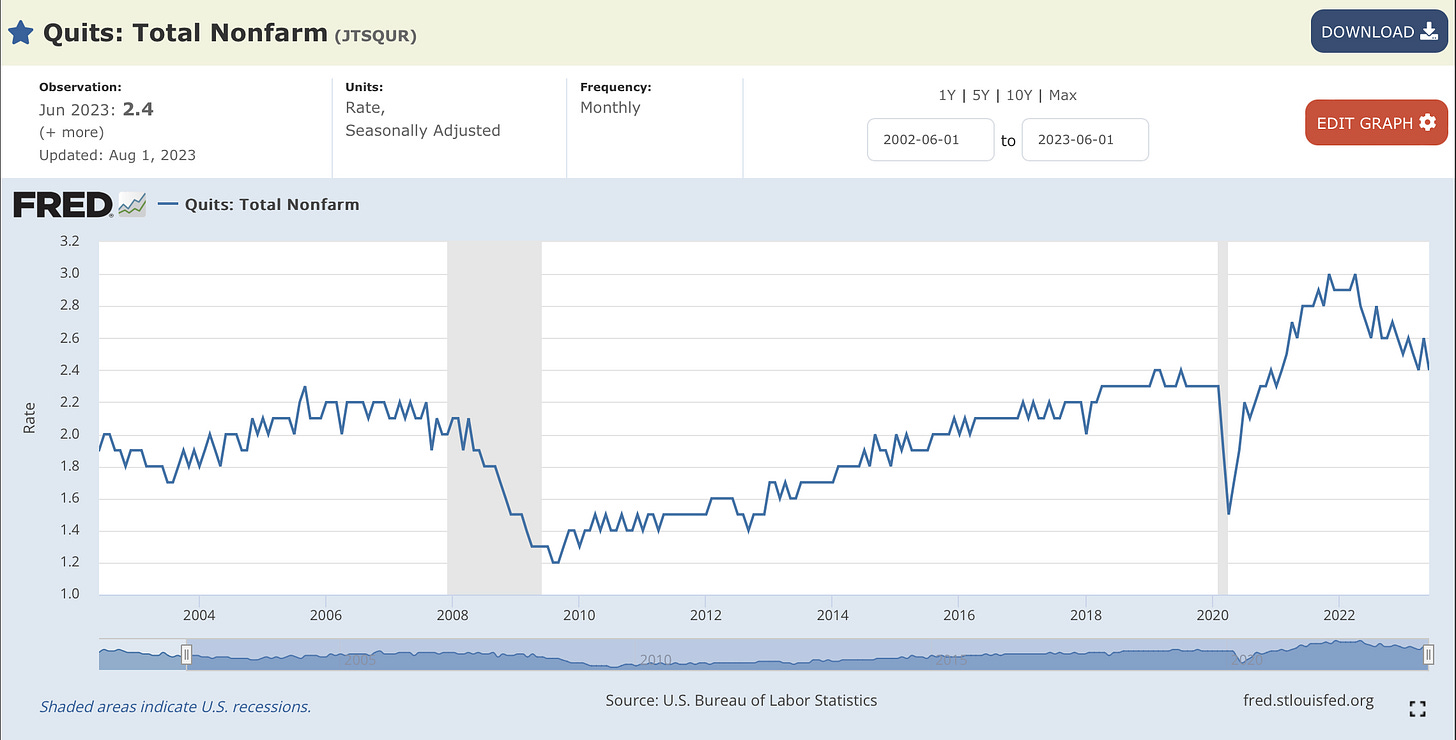
My last measure of labor market health is Quits. This looks at how many employees are quitting their jobs. A high number of quits indicates a healthy labor market and optimism. Rarely does anyone quit their job unless they are confident they can find another one.
Similar to initial unemployment claims and job postings, quits is also moving in the wrong direction.
Conclusion: Initial unemployment claims, job postings, and quits all tend to warn of labor market weakness prior to the start of a recession. At this point they are all flashing warning signs. I must point out that they have been warning of a recession for quite awhile at this point — so it isn’t advised to use this information as a reason to make a trade or investment.
Conclusion
This is an extremely difficult economic and market environment to navigate. Even though this model I employ is largely subjective, it is important to have a guide and principles that help anchor one’s thought and judgements about the world.
At the moment, the economic stage model points to Stagflation as the likely stage the economy finds itself in. This warrants some caution as a significant growth slowdown typically follows stagflation due to the contraction in credit that flows from tightening financial conditions spurred by central bank policy action.
It will be interesting to see how this all plays out.
— Brant
Disclaimer: The content provided on the Capital Notes newsletter is for general information purposes only. No information, materials, services, and other content provided in this post constitute solicitation, recommendation, endorsement or any financial, investment, or other advice. Seek independent professional consultation in the form of legal, financial, and fiscal advice before making any investment decision. Always perform your own due diligence.


